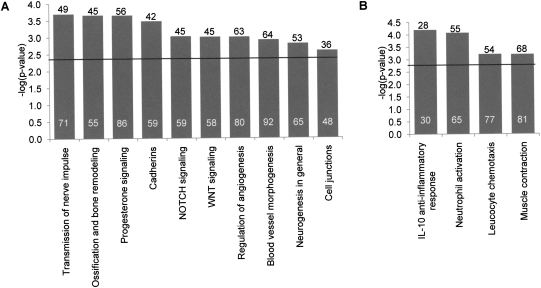
Figure 2.
Enrichment for gene networks in msHSBs and EBRs. The distribution of GeneGO MetaCore process network terms (Ekins et al. 2007) was determined for msHSBs >3 human-Mbp (A) and EBRs <1 human-Mbp (B). Numbers above the bars indicate the number of different msHSBs (A) and EBRs (B) containing genes associated with each process network. The number of genes in each process network in msHSBs and EBRs is given within bars. Only the gene networks that are significantly different in msHSBs or EBRs when compared to the rest of the human genome (FDR < 5%) are shown. The significance threshold for FDR = 5% is indicated by a horizontal bar.

