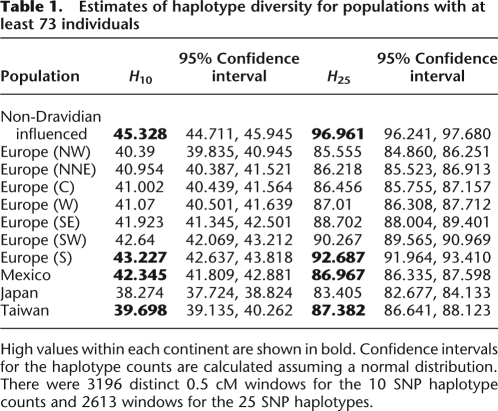
Table 1.
Estimates of haplotype diversity for populations with at least 73 individuals
High values within each continent are shown in bold. Confidence intervals for the haplotype counts are calculated assuming a normal distribution. There were 3196 distinct 0.5 cM windows for the 10 SNP haplotype counts and 2613 windows for the 25 SNP haplotypes.

