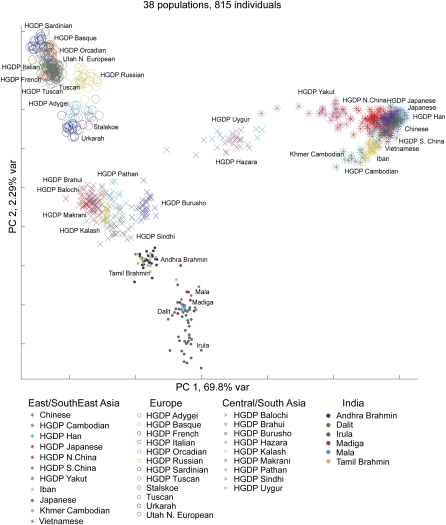
Figure 6.
Principal components analysis of population structure for 815 Eurasian individuals using 47,563 SNPs. The first two principal components (PCs) are shown. Individuals from East/Southeast Asia (asterisks), Europe (open circles), Central/South Asia (crosses), and India (filled circles) are indicated. The color label of each individual corresponds to his or her self-identified population origin. The percentage of the variation explained by each PC is shown on the axes. For the East/Southeast Asian region, Chinese ethnic groups in the HGDP panel were grouped into Northern China (Oroqen, Daur, Hezhen, Mongola, Xibo, and Tu), Southern China (Dai, Lahu, Miao, Naxi, She, Tujia, and Yi), and Han Chinese (Han and Han-NChina) to improve clarity.

