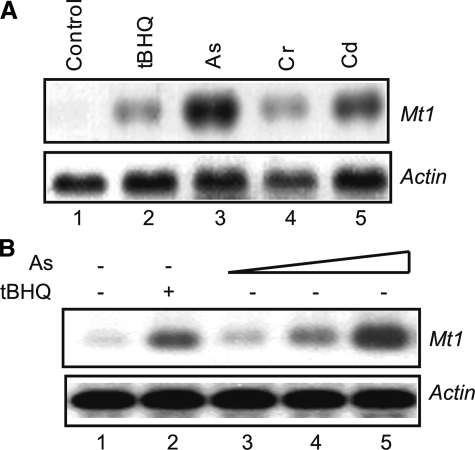
FIGURE 1.
Induction of Mt1 gene expression by arsenic. A, comparison of induction by metals and phenolic antioxidant. Hepa1c1c7 cells were treated with tBHQ (30 μm), As3+ (10 μm), Cr6+ (10 μm), or Cd2+ (10 μm) for 5 h. Total RNA was analyzed by Northern blotting. Actin was used as a loading control. B, concentration dependence. Cells were treated with tBHQ (30 μm) or As3+ at 1, 5, and 10 μm for 5 h. Total RNA was blotted with Mt1 and actin riboprobes.

