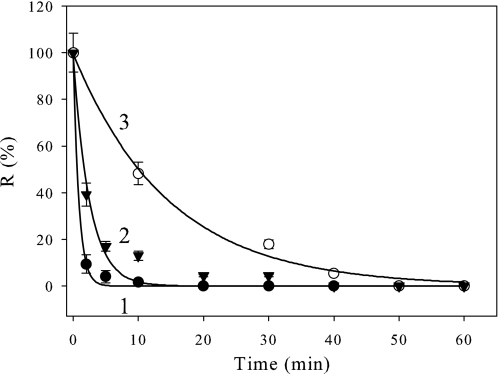
FIGURE 2.
Specificity of CP12 upon thermal inactivation of NADPH-GAPDH. 0.8 μm GAPDH was incubated at 43 °C alone (curve 1) or with a 1.6 μm concentration of either BSA (curve 2) or thioredoxin (curve 3) in 30 mm Tris, 100 mm NaCl, 2 mm EDTA, pH 7.9. The enzyme activity (R) is given as the percentage of the value at zero time. All data points are means ± S.D. of five experiments for GAPDH alone and of two experiments for GAPDH plus BSA or thioredoxin. The continuous lines correspond to the best fits to Equation 2, and the parameters are as follows: curve 1, p1 = 100 ± 2%, p2 = 0, and t½ = 0.59 ± 0.04 min; curve 2, p1 = 98 ± 5%, p2 = 0, and t½ = 1.7 ± 0.2 min; curve 3, p1 = 99 ± 2%, p2 = 0, t½ = 10.1 ± 0.6 min.

