FIGURE 7.
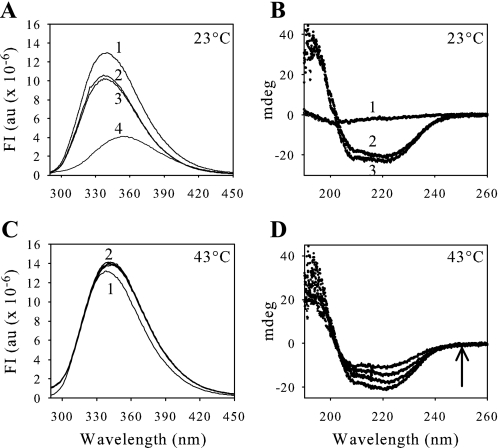
Fluorescence (A and C) and circular dichroism (B and D) analysis. A, fluorescence spectra, recorded at 23 °C, with an emission slit of 2 nm, correspond to 0.8 μm GAPDH alone (curve 1) or in the presence of 1.6 μm W35A mutant (curve 2) or 1.6 μm WT CP12 (curve 3). Curve 4 corresponds to the spectrum of 0.8 μm GAPDH denatured by 6 m guanidinium chloride. B, CD spectra, at 23 °C, were obtained with 1.6 μm CP12 (curve 1), 0.8 μm GAPDH (curve 2), and 1.6 μm CP12 plus 0.8 μm GAPDH (curve 3). C, fluorescence spectra of 0.8 μm GAPDH alone were recorded at 43 °C, curve 1 corresponding to the initial spectrum and all of the other curves (curve 2) corresponding to records from 10 min to 1 h of incubation. D, CD spectra of 0.8 μm GAPDH alone were recorded at 43 °C immediately and after 10, 20, and 40 min, as indicated by the arrow. The spectra obtained from 40 min to 2 h are the same. These experiments were carried out in a phosphate buffer at pH 7.9. FI, fluorescence intensity expressed in arbitrary units (au).

