FIGURE 6.
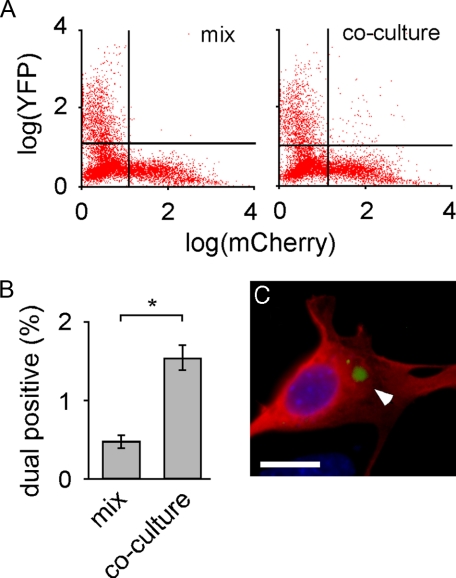
MTBR-YFP aggregates transfer between co-cultured cells. A, cells were transfected separately with mCherry or MTBR-YFP. The two cell populations were either mixed immediately prior to analysis or co-cultured for 24 h. Flow cytometry was used to quantify dual positive cells (10,000 cells sorted per condition). B, quantification of flow cytometry revealed that 0.5% of cells scored positive for mCherry and YFP (upper right quadrant of cell plot) when cells were simply mixed prior to sorting, versus 1.5% of cells that scored dual positive when cells were co-cultured for 24 h, indicating transfer of MTBR-YFP between cells. *, p < 10-5 (unpaired t test, n = 4, 10,000 cells sorted per experiment). C, dual positive cells were collected via FACS, fixed, and mounted. A MTBR-YFP inclusion (white arrowhead) is visible within an mCherry-expressing cell. Scale bar, 10 μm.

