
Figure 2.
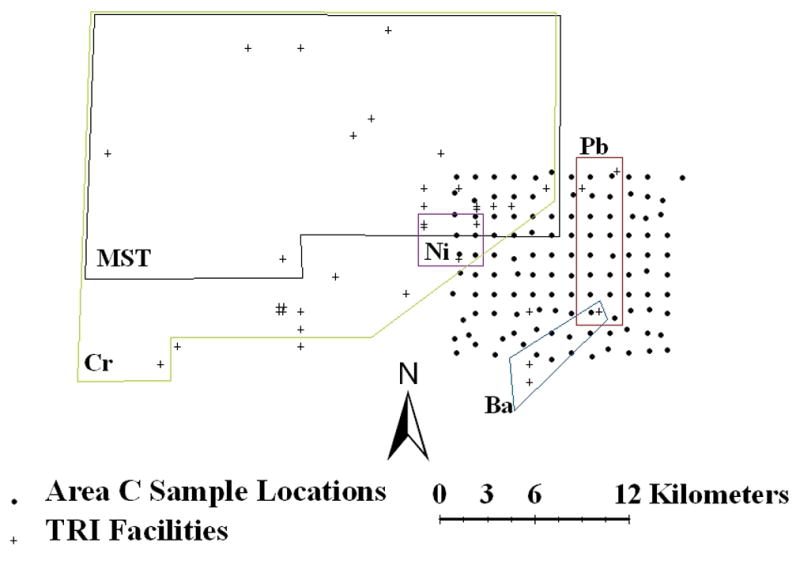
Locations of facilities (+) and soil samples (●) in Area C identifying approximate areas over which distance to facility and metal concentrations and Microtox® Soil Toxicity (MST) were correlated (p ≤ 0.05) as determined using ArcGIS® and SAS. All metals are labeled next to or within boxes corresponding to facilities with distances significantly correlated to concentrations of that metal (Mn not shown). Multiple facilities at one location are represented by multiple +s so that ‡ represents two and ‡‡ represents four facilities in close proximity. Facilities not included within boxes were not significantly correlated by distance to any metal or MST value.