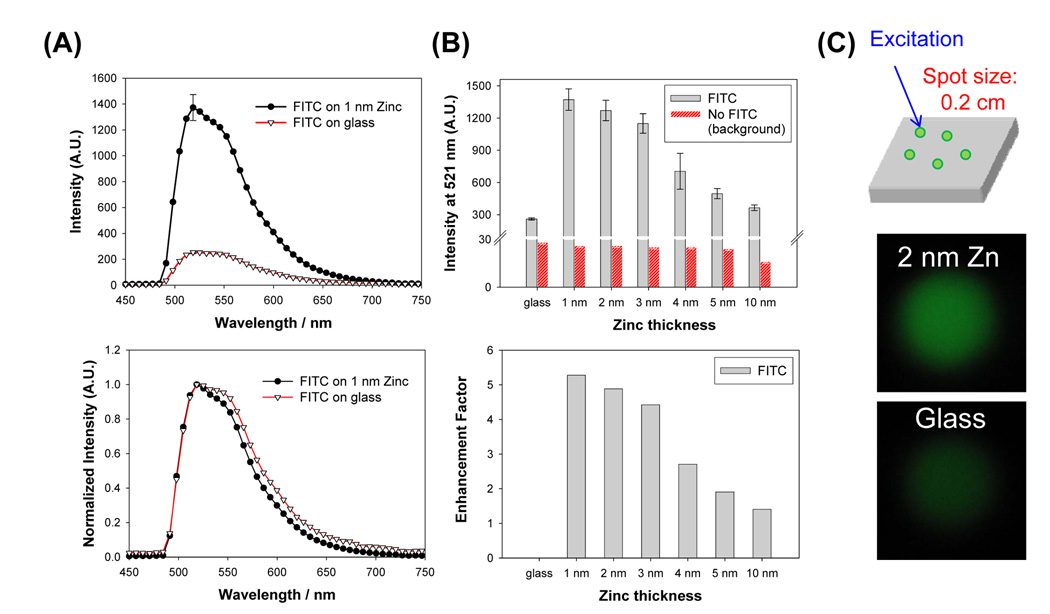
Figure 6.
(A) Raw (top) and normalized (bottom) fluorescence emission spectrum of FITC from zinc (1nm thick) and glass substrates. (B) Fluorescence emission intensity of FITC measured (at 521 nm) from glass and zinc substrates (top) and calculated fluorescence enhancement factor for FITC. (C) Sample geometry and real-color photographs of FITC emission from 2 nm zinc (top) and glass (bottom) substrates taken through an emission filter. Average of 5 measurements collected from different spots on the samples are shown. Enhancement factor is calculated as the ratio of the intensity at 521 nm on zinc substrates to glass. A.U. Arbitrary Units.

