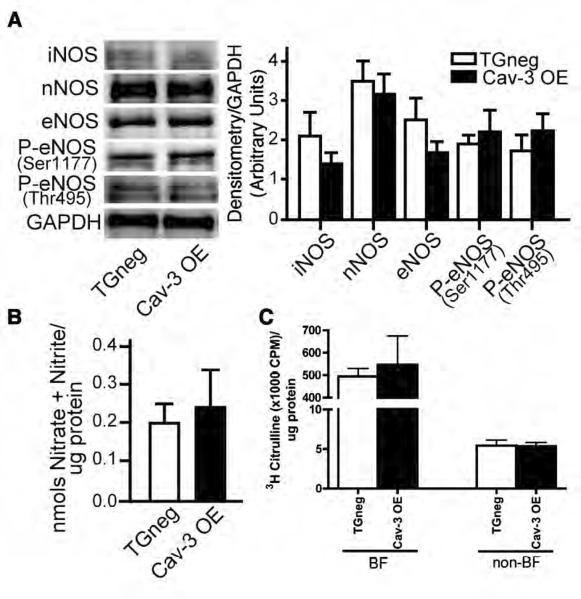
Figure 4. NOS expression and activity.
(A) Immunoblot analysis of basal expression of NOS and phosphorylated eNOS in TGneg and Cav-3 OE mice (left panel). Densitometry was normalized to GAPDH (right panel). No differences were observed in expression of any NOS isoforms. Data are from 5 mice per group. (B) Basal NOS activity was measured in TGneg and Cav-3 OE murine whole heart homogenates. No differences in basal NOS activity was observed between groups. (C) Hearts from TGneg and Cav-3 OE mice were homogenized in triton-X and fractionated on a discontinuous sucrose density gradient to separate buoyant (caveolae) and non-buoyant (non-caveolar membrane) fractions (BF and non-BF, respectively). NOS activity was measured in BF and non-BF using a [3H]-arginine assay. No difference in NOS activity was observed in the two separate fractions in TGneg vs. Cav-3 OE mice. Data are from 6 mice per group.

