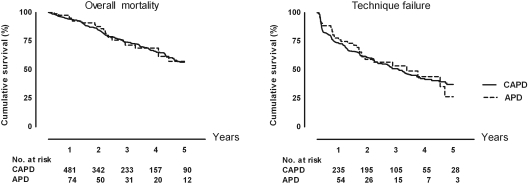
Figure 1.
Left: Kaplan-Meier curve of overall mortality on automated peritoneal dialysis compared with continuous ambulatory peritoneal dialysis. Right: Kaplan-Meier curve of pure technique failure on automated peritoneal dialysis compared with continuous ambulatory peritoneal dialysis. The numbers under the graphs show the number of patients at risk.

