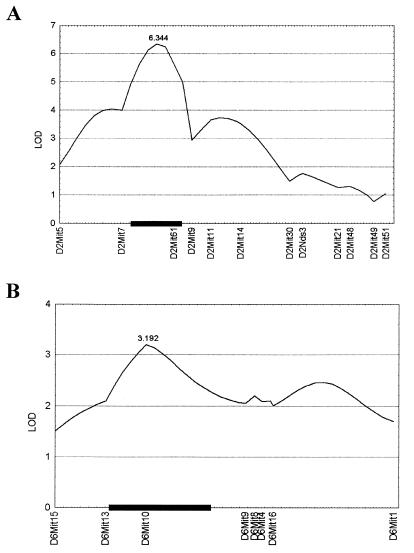
Figure 1.
QTL plots for each chromosome containing non-Mhc linked loci using the histology index data. Log-likelihood values were determined by using mapmaker/qtl 1.1b. lod scores are presented on the y axis, and positions of the marker loci along the chromosome are given on the x axes. Support intervals are given by the black box. (A) Chromosome 2. Markers are presented centromere to telomere. (B) Chromosome 6. Markers are presented telomere to centromere.

