
Figure 1. Tumor-specific CTL expansion correlates with tumor regression.
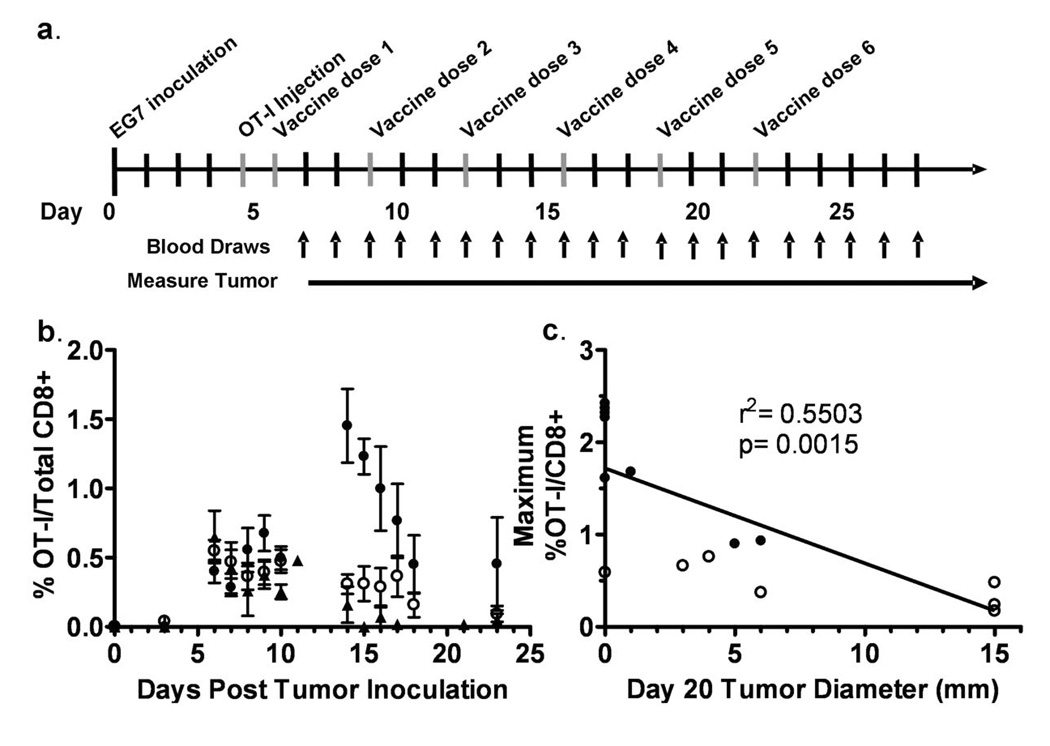
(a) The schedule of EG7 tumor inoculation, OT-I injection and immunizations is shown. (b) The percentage of OT-I cells out of total CD8+ cells in the lymphoid compartment was determined by flow cytometry. Open circles (○) and closed circles (●) indicate EG7-gp96-Ig immunized mice (7 representative mice per group, broken into two groups based on observed dichotomy in OT-I expansion), closed triangles (two representative mice shown) indicate non-vaccinated control mice (▲). (c) The maximum percentage of OT-I cells out of total CD8+ lymphoid cells between experimental days 10–20 is plotted on the y-axis and the tumor diameter at experimental day 20 is plotted on the x-axis. Open and closed circles correspond to the maximum OT-I expansion of mice displayed in (b). A linear regression analysis was performed and found to be statistically significant with p=0.0015 and with a correlation coefficient (r2) of 0.5503, with n=14.