
Figure 3. Tumor regression and CTL expansion occur following the expression of Th1 and Th17 polarizing factors at the site of vaccination.
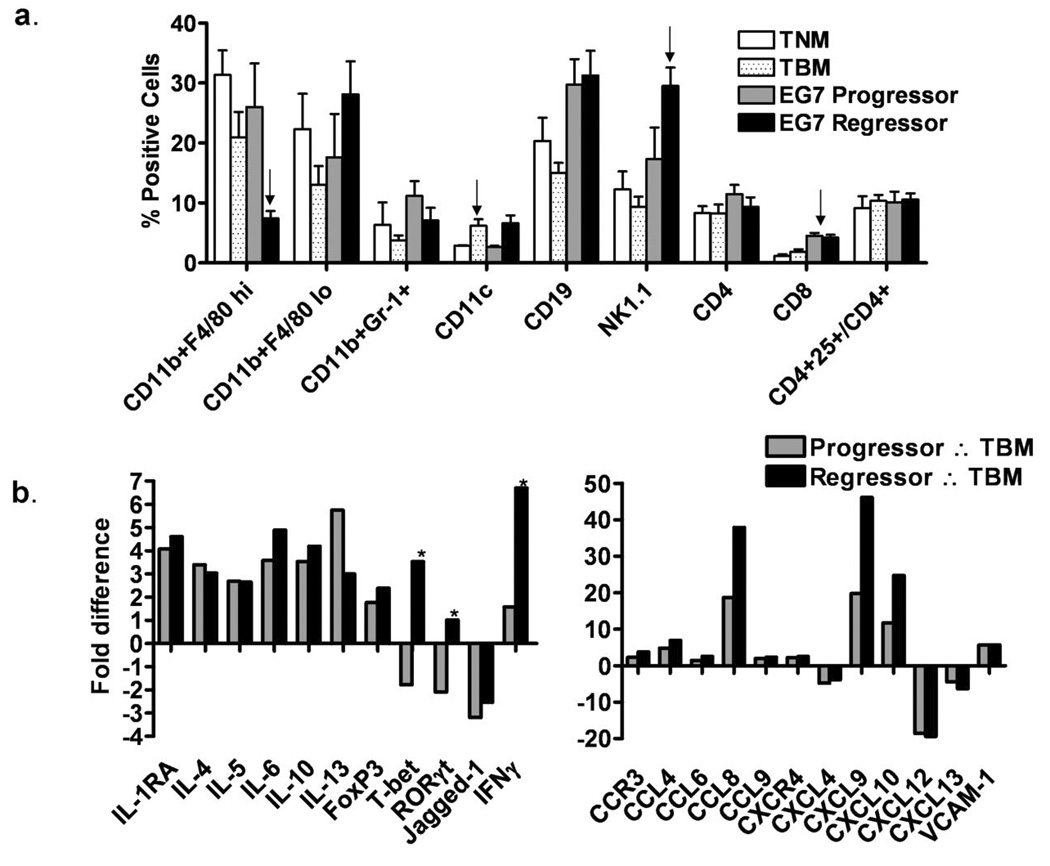
(a) PECs were collected from tumor naïve mice (TNM) or EG7 tumor bearing mice (EG7 TBM) and analyzed by flow cytometry for the indicated surface markers. There were no statistically significant differences between groups. (b) RT-PCR was performed using a custom 96-well array (supplementary figure 1) to examine differences between EG7 tumor ‘progressors’, tumor ‘regressors’ and TBM controls. As compared to TBM controls, each of the differences indicated for ‘progressors’ (gray bars) or ‘regressors’ (black bars) reached statistical significance (p<0.05). Statistically significant differences for the ‘regressors’ as compared to the ‘progressors’ are indicated above the blue bars with an asterisk (p<0.05). n≥5 arrays (with a single array per mouse) for each of the 4 conditions (TNM, TBM, progressor and regressor).