
Fig 4.
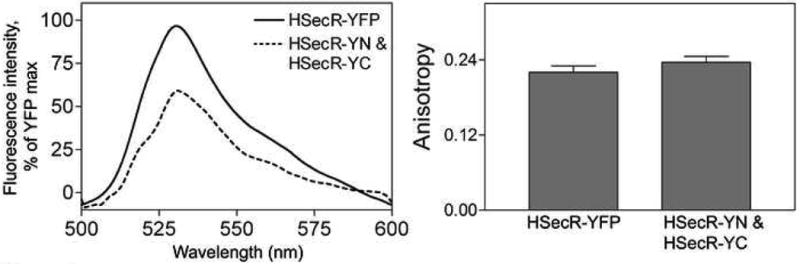
Fluorescence spectra and anisotropy of receptor tagged with fragments of YFP. Shown are fluorescence emission spectra (left panel) and steady state fluorescence anisotropy data (right panel) for intact YFP-tagged secretin receptor and YFP reconstituted from its fragments attached to secretin receptor constructs that were co-expressed in COS cells. The cells were excited at 480 nm and emission was acquired from the region between 500 nm and 600 nm. Data represent means ± S.E.M. of values from four independent experiments performed in duplicate.