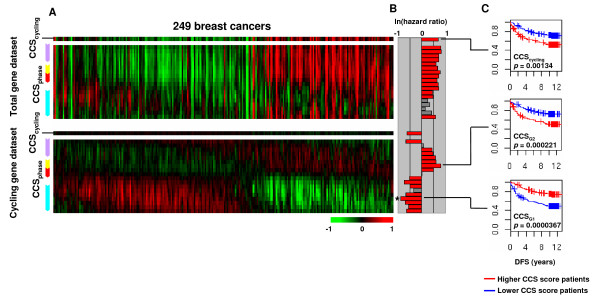
Figure 4.
Analysis of the Ivshina et al. human breast cancer dataset. (A) CCS score heat maps for the Ivshina et al. dataset. Patients were aligned by the peak in CCSphase scores for the cycling gene dataset. (B) Prognostic values of each CCS for disease free survival (DFS). Patients were dichotomized by the median of each CCS score and risk differences of two groups for DFS were assessed by log-lank test and Cox univariate analysis. Log scale hazard ratios are indicated by the colored bars: log-rank p < 0.05 (red), and p ≥ 0.05 (gray). The highest prognostic value is indicated by (*). (C) Survival curves for selected signatures. Higher CCS score patients (blue); lower CCS score patients (red).

