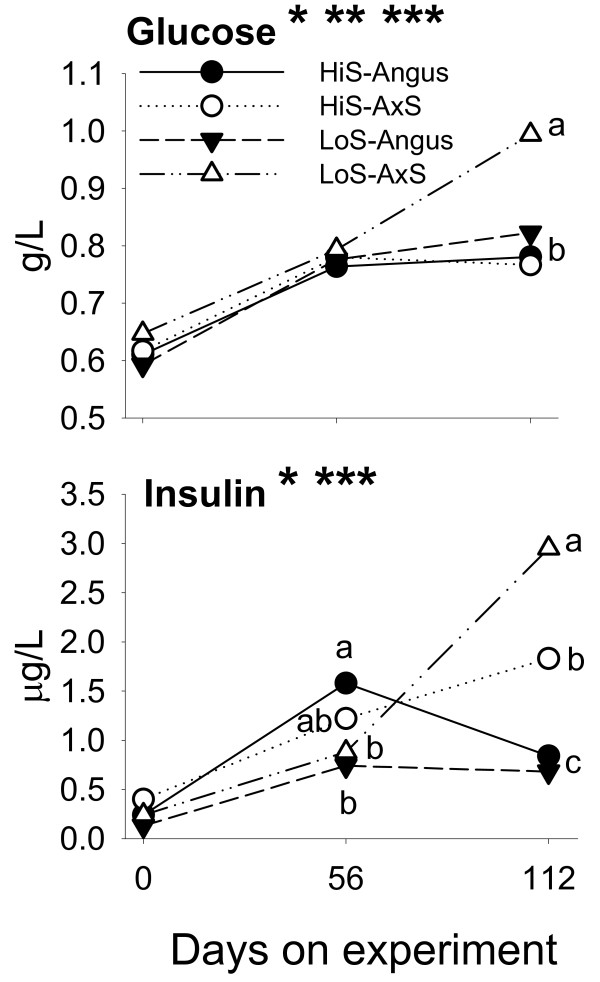
Figure 1.
Blood serum concentrations of glucose and insulin during the growing phase in Angus or A × S steers (n = 6/type) fed a high-starch (HiS, n = 3/type) or low-starch (LoS, n = 3/type) diet. Asterisks denote (P < 0.05): *Time effect; **Diet effect; ***Steer type effect. Glucose had (P < 0.05) a diet × steer type interaction effect. Insulin had (P < 0.05) diet × steer type and diet × steer type × day interactions. Superscripts denote differences (P < 0.06) among treatments at specific time points.

