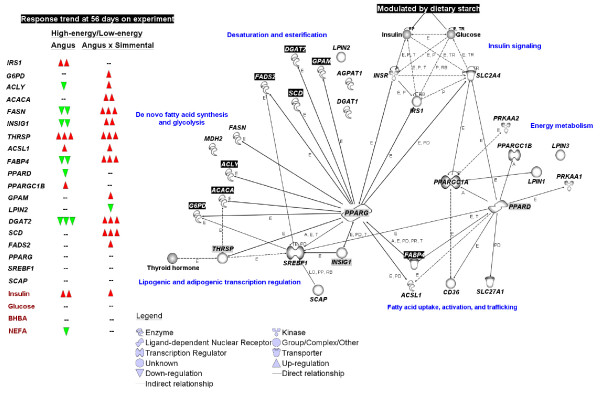
Figure 5.
Major trends in mRNA expression at 56 days on experimental diets and summary network analysis among genes. The complete network including currently-known relationships among genes in non-ruminants from the Ingenuity Pathway Analysis® knowledge base is available in Additional File 1. The PPARG relationships depicted are based on the relative responses found in the present study and do not represent actual fold-changes in expression as those are depicted in Figure 2–4. Relationships dealing with insulin and glucose signaling via INSR, SLC2A4, IRS1, and their link with PPARG were from the Ingenuity Pathway Analysis® knowledge base and have been discussed to some extent in the review by Fernyhough et al. [6]. Other relationships from the Ingenuity Pathway Analysis® knowledge base include those encompassing genes associated primarily with energy metabolism. Genes with black-colored background had fold-changes in mRNA expression ≥ 2-fold in at least one time point in all groups. Genes with grey-colored background appear central for transcriptional regulation of adipogenesis and energy metabolism. Together with clustering analysis (Additional File 1), data suggest that PPARγ activity through up-regulation of FABP4, DGAT2, FASN, and SCD is crucial for adipogenesis. The transcription factor THRSP was dramatically up-regulated by the high-energy diet regardless of steer type and might constitute an important transcription regulator of adipogenesis.

