Figure 1.
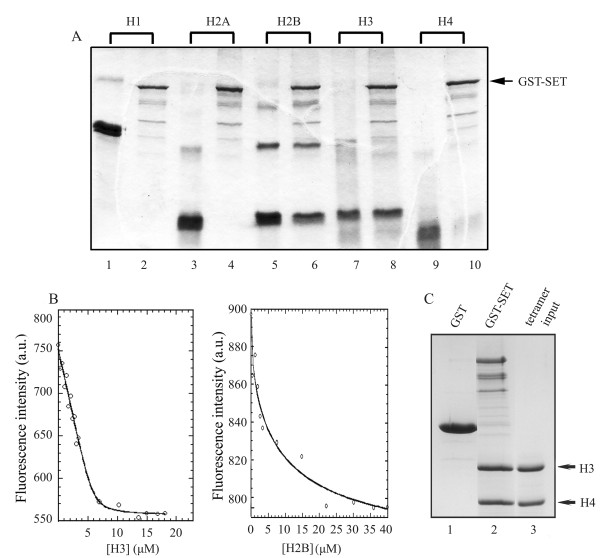
Histone binding properties of SET/TAF-Iβ. (A) SET/TAF-Iβ binding to histones. Purified GST-SET/TAF-Iβ (2 μg) was immobilised on glutathione-agarose beads and incubated with 4 μg of H1 (lane 2) or core histones H2A, H2B, H3, H4 (lanes 4, 6, 8, 10, respectively) as indicated in Materials and Methods. The beads were washed and analysed by SDS-PAGE and Coomassie blue staining. Lanes 1, 3, 5, 7, 9 indicate the input of the histones. (B) Fluorescence-based binding assays. SET/TAF-Iβ at an initial concentration of 4 μM was titrated with increasing amounts of purified calf thymus H3 (left panel) or H2B (right panel) stock solutions in PBS buffer. SET/TAF-Iβ binding to histones H3 and H2B was followed by monitoring the intensity of the fluorescence emitted at 345 nm after excitation at 295 nm. The solid line represents the binding curve derived by non-linear regression analysis of the fluorescence values corrected for dilution and for buffer contribution. (C) SET/TAF-Iβ binding to (H3/H4)2 tetramers. GST (lane 1) and GST-SET/TAF-Iβ (lane 2) were immobilised on glutathione-agarose beads and incubated with reconstituted (H3/H4)2 tetramers (lane 3) as indicated in Materials and Methods. The beads were washed and bound proteins were analysed by SDS-PAGE and Coomassie blue staining.

