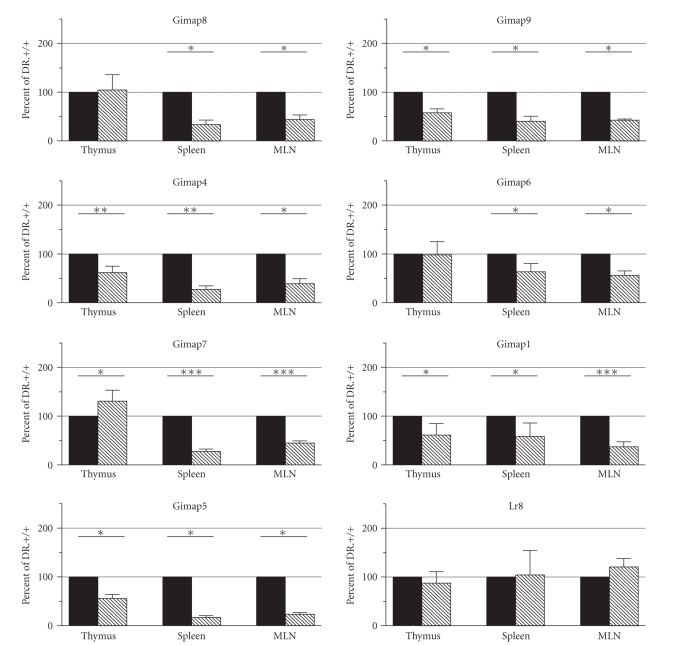
Figure 4.
Gimap gene expression in the DR.+/+ and DR.lyp/lyp rats. The mean ± standard deviation is shown for DR.+/+ and DR.lyp/lyp rat Gimap gene expression in thymus (n = 5), spleen (n = 5) and mesenteric lymph node (MLN) (n = 4) after normalization to cyclophilin. Black columns represent DR.+/+ and grey hatched columns represent DR.lyp/lyp. Data is expressed as a percentage of DR.+/+. Significant differences are follows; ∗ for P < .05, ∗∗ for P < .01, ∗∗∗ for P < .001. Genes appear in the order at which they appear on rat chromosome 4. The average Gimap expression in DR.+/+ rat bone marrow and kidney s is shown in Figure 3.

