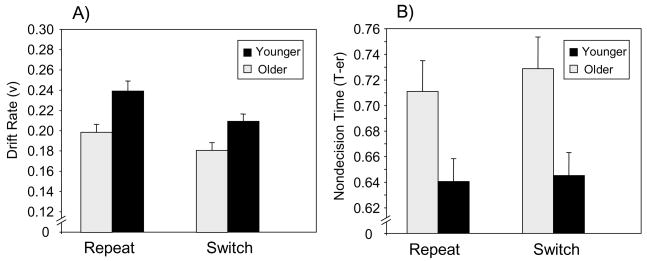
Figure 3.
Mean parameter estimates (Wagenmakers, van der Maas, & Grasman, 2007) of task switching performance, as a function of age group and repeat versus switch trials. Panel A = the drift rate parameter (v), representing the quality of decision processing; Panel B = the nondecision time parameter (T-er), representing perceptual encoding and response time.

