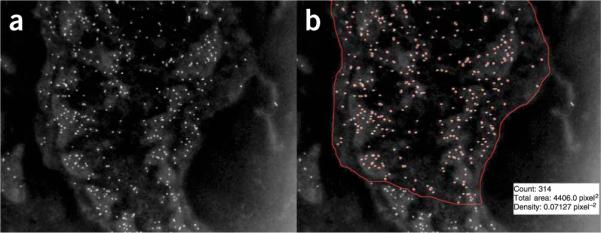
Figure 1.

Quantification of gold particle density using image processing and analysis. In the inverted digital image collected by TEM (a) antigenic sites labeled with gold particles appear over the cell surface as bright dots of uniform size. The macro analysis of this image (b) detects, counts and outlines the particles, and also outputs the manually circumscribed area (red line enclosing the cell area). As shown for the fibroblast illustrated here (with pA-AU-labeled antigenic sites to PDGF-Rβ): the gold particle count is 314; the area analyzed is 4406.0 pixel2 and the density is 0.07127 pixel-2, which translates (from the number of nanometers per pixel) to an area of 3.90 μm2 and a calculated density of 80.0 μm-2.
