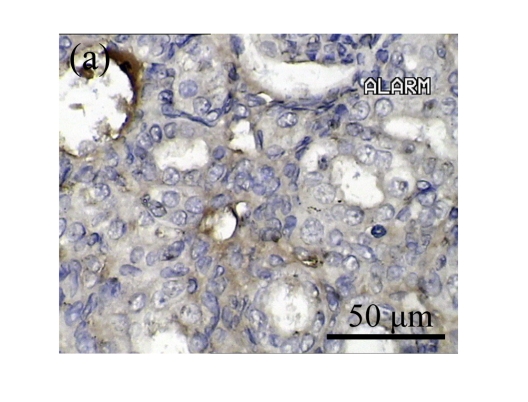
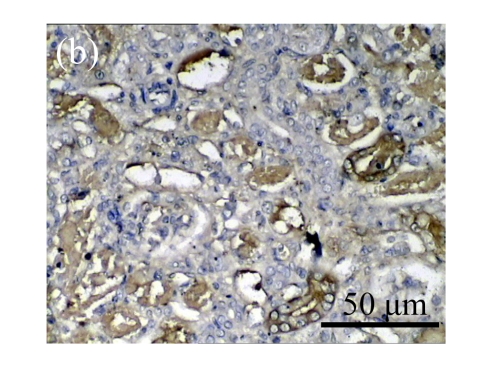
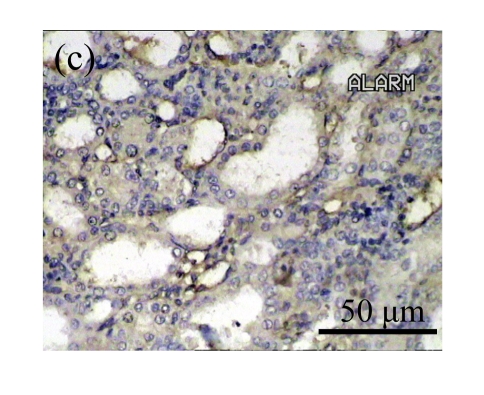
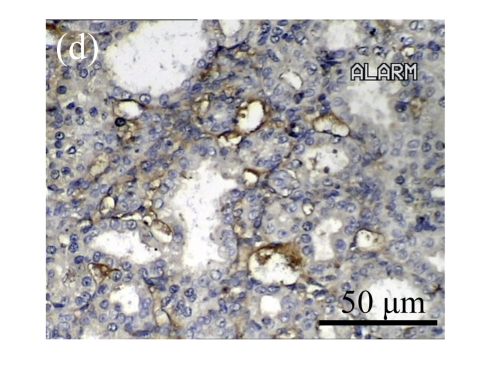
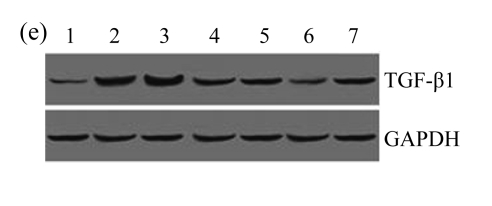
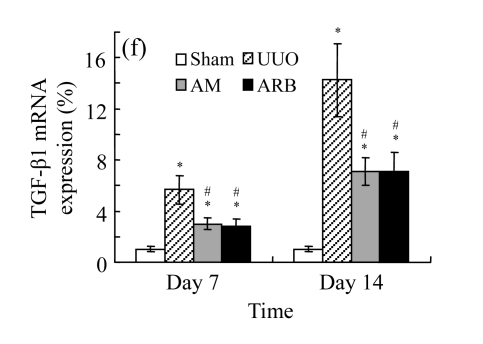
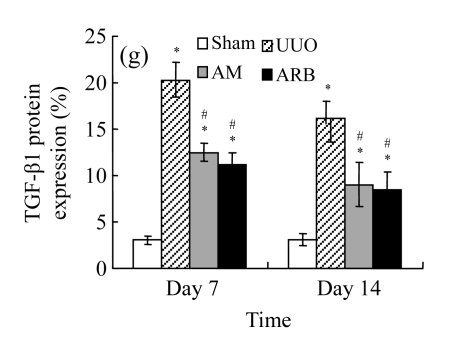
Fig. 4.
The effect of AM on TGF-β1 protein and mRNA expressions by immunohistochemical staining, Western blot, and RT-PCR detection. (a~d) Representative photographs of TGF-β1 visualized by immunohistochemical staining in different groups on Day 14 after operation: (a) sham-operated control rats, (b) untreated UUO control rats, (c) AM-treated rats, and (d) losartan-treated rats; (e) Comparison of TGF-β1 protein expression in renal tissues of different groups by Western blot analysis (Lane 1: Sham group; Lane 2: UUO group on Day 7; Lane 3: UUO group on Day 14; Lane 4: AM group on Day 7; Lane 5: AM group on Day 14; Lane 6: ABR group on Day 7; Lane 7: ABR group on Day 14); (f) TGF-β1 mRNA expression in renal tissues of different groups by semi-quantitative RT-PCR analysis; (g) Change in TGF-β1 protein expression in renal tissues of different groups by immunohistochemical analysis. The overexpressions of TGF-β1 mRNA and protein in the obstructed kidneys were significantly decreased in the AM and ARB groups. Data are expressed as mean±SD (n=6); * P<0.05 vs the Sham group, # P<0.05 vs the UUO group

