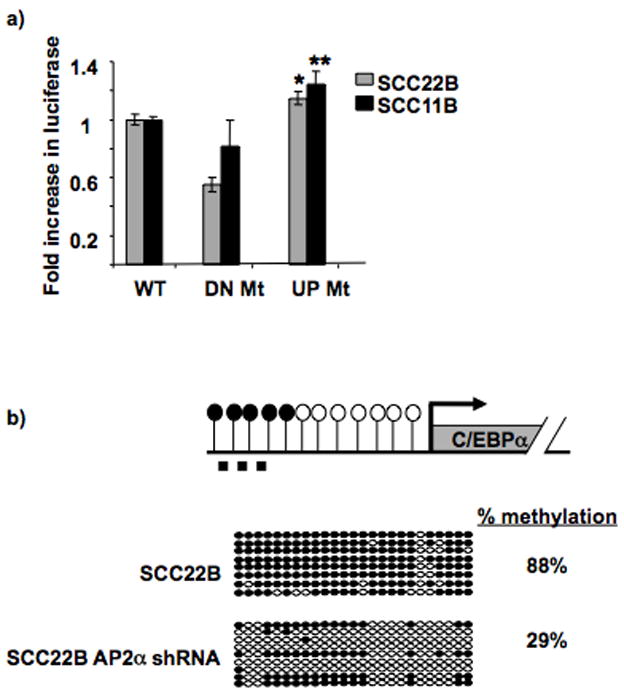
Figure 3. AP2α site mutagenesis or protein downregulation increases C/EBPα promoter activity and decreases upstream methylation, respectively.

a. AP2α site mutagenesis increases C/EBPα promoter activity. The graph displays the relative fold increase in luciferase activity with the C/EBPα promoter constructs containing the mutation in the upstream AP2α site (−1419 bp; “UP Mt”) compared to the WT promoter (“WT”; which is set as 1) in both SCC11B and 22B. The previously identified downstream AP2α site (−311bp; “DN Mt”) which does not suppress C/EBPα promoter activity in HNSCC was mutated as a control, and it showed no increase in promoter activity compared to “WT”. * P = 0.032; ** P = 0.031. Black bars = SCC11B; Gray bars = SCC22B.
b. AP2α downregulation provides decreased upstream C/EBPα methylation. Diagram depicts C/EBPα and its upstream sequence. CpG sites’ methylation status is shown by open (unmethylated) and closed (methylated) circles. The dashed line represents the region analyzed by bisulfite sequencing (−1423bp to −1121bp). Bisulfite sequencing analysis was performed on SCC22B cells before and after AP2α stable shRNA silencing. The region tested for methylation via bisulfite sequencing spans from −1423 bp to −1121 bp. Bisulfite sequencing was performed by comparing the sequences with 100% and 0% methylated DNA sequence (i.e. CG or TG at CpG sites, respectively). Open circles represent unmethylated CpGs, and closed circles represent methylated CpGs. Each row represents an individual clone. Percentage methylation is shown for the two cell types.
