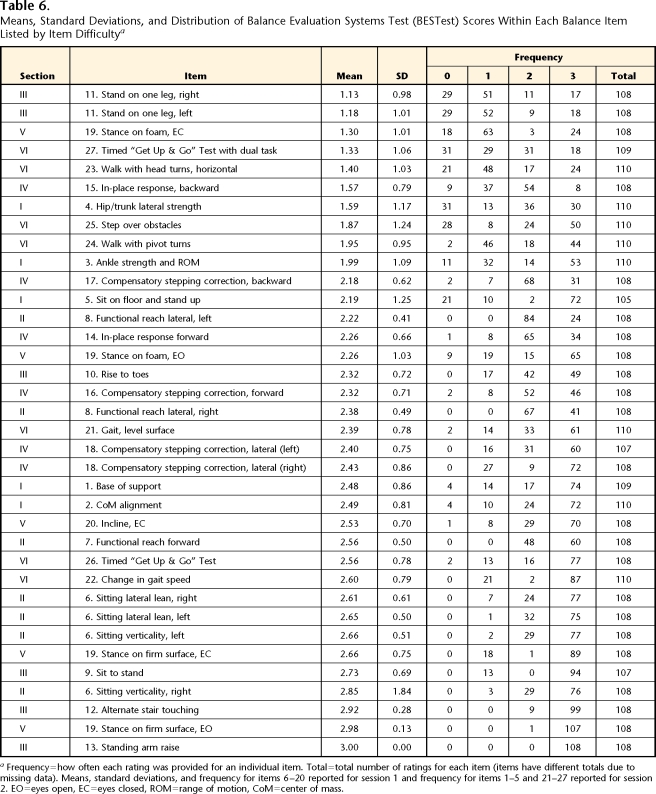
Table 6.
Means, Standard Deviations, and Distribution of Balance Evaluation Systems Test (BESTest) Scores Within Each Balance Item Listed by Item Difficultya
Frequency=how often each rating was provided for an individual item. Total=total number of ratings for each item (items have different totals due to missing data). Means, standard deviations, and frequency for items 6–20 reported for session 1 and frequency for items 1–5 and 21–27 reported for session 2. EO=eyes open, EC=eyes closed, ROM=range of motion, CoM=center of mass.

