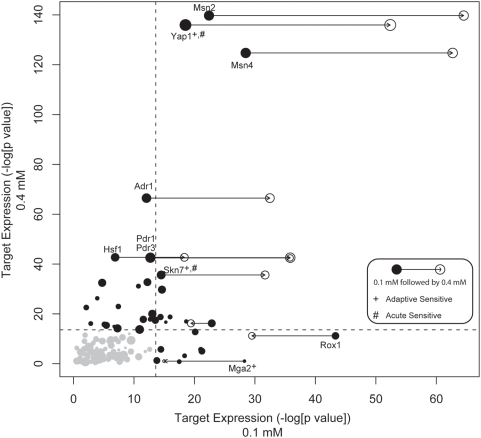
Figure 4. Dynamics of transcription factor target expression in mild and acute conditions.
For each transcription factor, we compute a score based on a hypergeometric test representing the significance of increased expression (relative to untreated) of known targets (see Methods) following either pretreatment (0.1 mM H2O2, x-axis) or acute treatment (0.4 mM H2O2, y-axis). For those transcription factors with the most significant activity following pre- or acute treatment, the activity following adaptive treatment (0.1 mM followed by 0.4 mM H2O2) is also displayed on the x-axis with an open circle. The size of each point corresponds to the number of known targets of that transcription factor. The dotted lines indicate a threshold for significance determined by a randomization procedure (see Methods). Although there is significant overlap in the set of expressed genes following mild and acute treatment, examination of specific transcription factors reveals those with unique behavior in each condition. Transcription factors identified in the deletion fitness analysis of the acute and adaptive treatments are indicated with “#” and “+” symbols, respectively.

