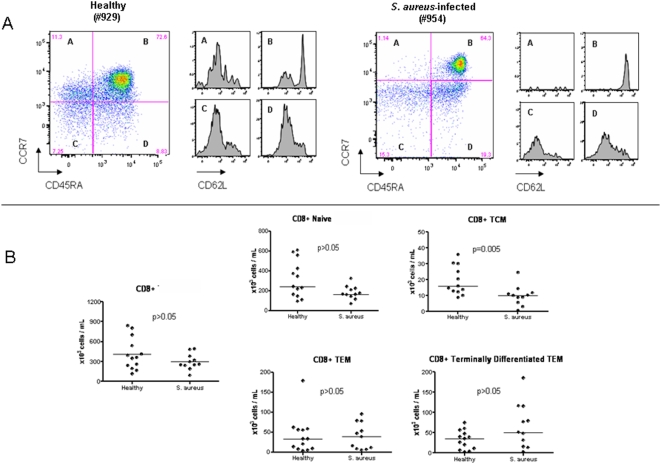
Figure 6. Analysis of the CD8+ T cell compartment.
PBMCs obtained from patients with S. aureus infections (n = 11) and age-matched healthy controls (n = 13) were stained with CD3, CD8, CCR7, CD45RA, and CD62L antibodies and analyzed by flow cytometry. CD 8 T cells and CD 8 T cell subsets are labeled as: (A) central memory T cells (TCM); (B) naïve T cells, (C) effector memory T cells (TEM), and (D) terminally differentiated effector T cells (TEM). (a) Flow cytometry plots show CD8 T cell subsets in a representative S. aureus patient and healthy control. CD62L expression is shown for each CD8 T cell subset. (b) Graphs show the absolute numbers of CD8 T cells and CD8 T cell subsets. Results are expressed as absolute number of cells per mL of blood. Horizontal lines represent median values. Statistical analysis was performed using a Mann-Whitney test.

