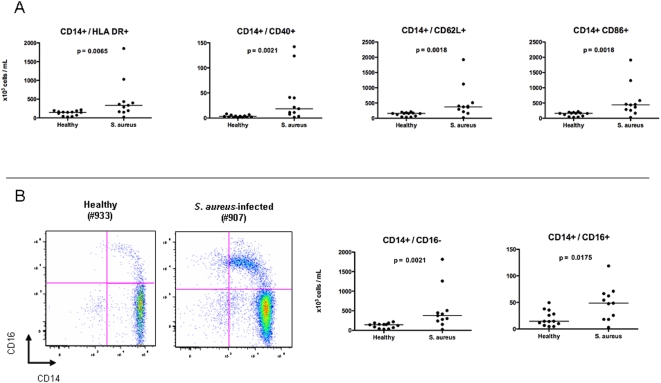
Figure 7. Analysis of monocyte compartment.
PBMCs obtained from patients with S. aureus infections (n = 11) and age-matched healthy controls (n = 13) were stained with Monocytes expressing HLA DR, CD40, CD62L, CD16, and CD86 antibodies and analyzed by flow cytometry. (a) Graphs show the absolute monocyte cell numbers. Results are expressed as absolute number of cells per mL of blood. Horizontal lines represent median values. Statistical analysis was performed using a Mann-Whitney test. (b) There was a significant expansion of both the CD14+ CD16− and the CD14+ CD16+ monocyte populations as shown in a flow cytometry plot of a representative S. aureus patient (907) and healthy control (933).

