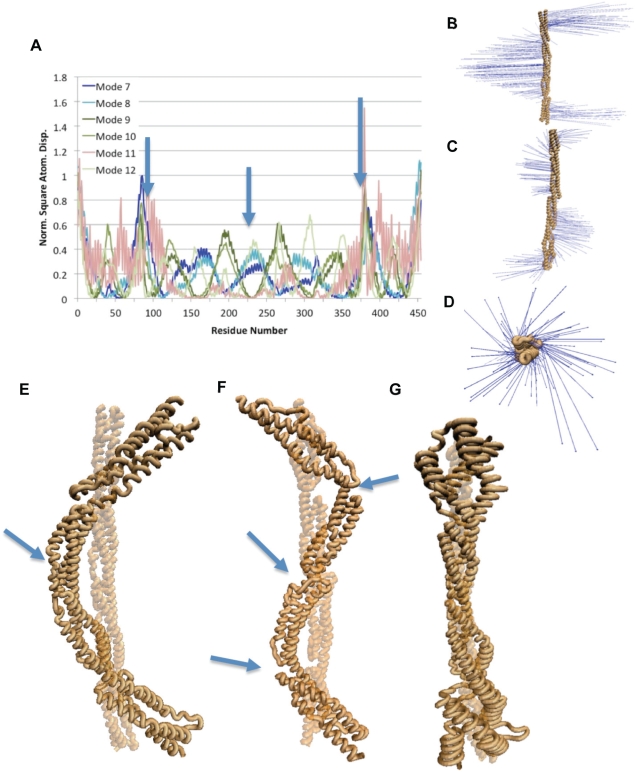
Figure 2. Normal mode analysis of the α-actinin monomer revealed bending and torsional natural frequencies.
A) RMSD of individual residues for six lowest vibrational modes. Natural movements consisted mainly of movement in the regions near the termini. Single-hinge bending modes are shown in blue colors, three-hinge bending modes in green colors, and the torsional mode is shown in pink. Arrows indicate location of hinges. B) Vector field representation of movements during one-hinge bending normal modes. Vector field representations show the direction and magnitude of movement of each residue in the molecule. Larger vectors represent larger movements. Mode 7 and mode 8 exhibited this type of bending motion. C) Vector field representation of movements during three-hinge bending modes. Mode 9, mode 10, and mode 12 showed three-hinge bending movement. D) Vector field representation of movement in the torsional mode. In the α-actinin monomer normal mode analysis only mode 11 showed torsional movement. E) Image captures movement characteristic of the single-hinge bending modes (7 and 8). Arrow points to location of the single-hinge. F) Image captures movement characteristic of the three-hinge bending modes (9, 10, and 12). Arrows point to location of the three hinges. G) Image showing the torsional movement in mode 11. Images were rendered using VMD [52]. RMSD plots were created using WEBnm@ [47].

