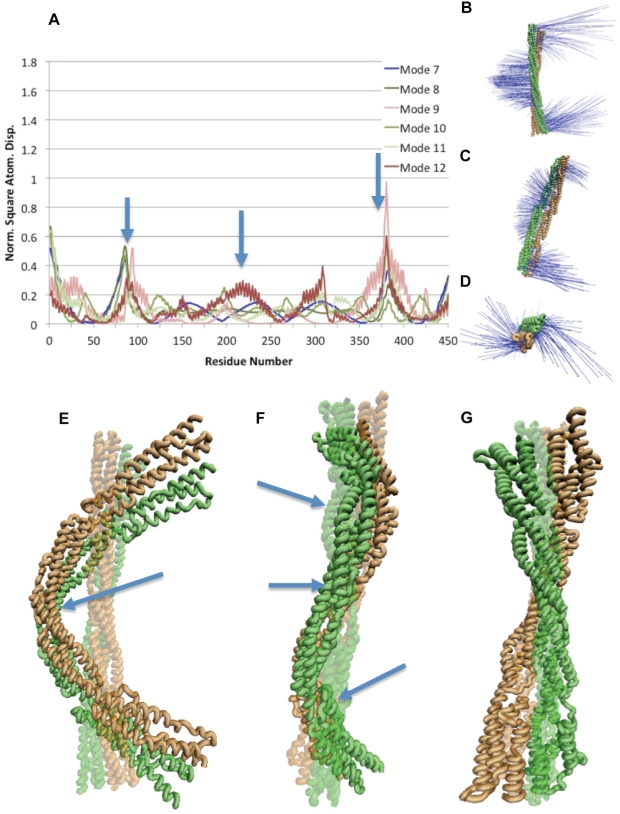
Figure 3. Natural frequencies of the α-actinin dimer.
Normal mode analysis using WEBnm@ [47] on the α-actinin dimer revealed modes with bending, twisting, and both motions. A) Six lowest vibrational modes of the α-actinin dimer shown with RMSD analysis of individual residues. In all modes vibrations are seen mainly at the termini (near residues 1, residues 475, and residues 950). Plot of single-hinge bending modes are shown in blue colors, three-hinge bending and torsion modes shown in green colors, and torsional modes shown in red colors. Arrows indicate location of hinges. B) Vector field representation of bending vibrational motion in mode 7. C) Vector field representation of the simultaneous bending and twisting vibrations in modes 8, 10, and 11. D) Vector field representation of torsional vibrations seen in mode 9 and 12. E) VMD [52] rendered image of the vibration in mode 7 characteristic of bending. Arrow points to single-hinge in bending mode. F) Bending and twisting motion, at the same time, shown here in a VMD representation. Modes 8,10, and 11 exhibit simultaneous bending and twisting. Arrows point to location of three hinges. G) The torsional motion of modes 9 and 12 captured in VMD. Most of the torsional natural vibration is at the termini.

