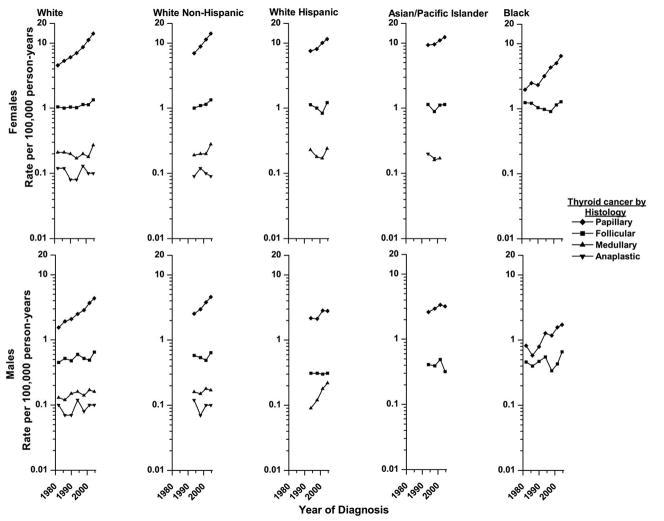
Figure 1.
Histology-specific trends in thyroid cancer incidence in SEER* diagnosed from 1980–1983 to 2003–2005 by sex and race/ethnicity.
Rates are age-adjusted (2000 US Standard Population) and each point represents 3 or 4-years.
*Nine regions were included for the Whites and Blacks and eleven were included for the White non-Hispanics, White Hispanics and Asian/Pacific Islanders.

