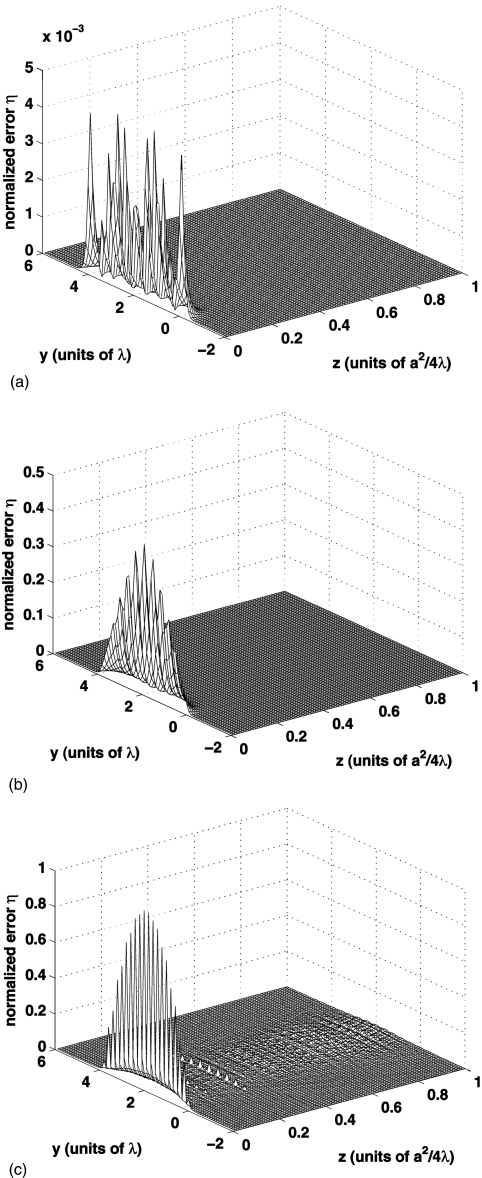
Figure 5.
The normalized error distribution η(x,y,z;k) describes the difference between the reference pressure field and the computed pressure field for an apodized 4λ×4λ source. The error distribution η is plotted for (a) the apodized FNM evaluated with 16-point Gauss quadrature in each direction, (b) the apodized Rayleigh integral evaluated with 16-point Gauss quadrature in each direction, and (c) the FIELD II program evaluated with fs=48 MHz and 30 subdivisions in each direction.

