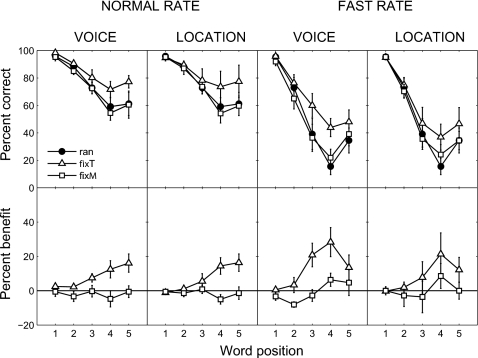
Figure 2.
Top row: Group mean percent correct scored according to target word position in the sequence. Each column shows the results for a different rate∕linkage variable. The parameter in each panel is whether the target (open triangles), masker (open squares), or neither (filled circles) was fixed. The error bars represent standard errors of the means. Bottom row: Group mean benefits provided by fixing linkage variables as a function of word position. The benefits are calculated by subtracting the percent correct score in the random condition from the percent correct score in the test condition.

