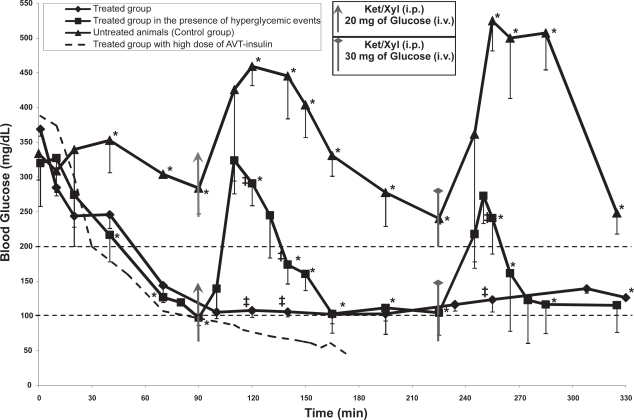
Figure 4.
Blood glucose concentration over the period of ~6 hrs of the untreated group (n = 3), treated group with lung instillation of the AVT particle containing 1.4 IU/kg (n = 3), and the treated group with lung instillation of the AVT particle containing 1.4 IU/kg followed by hyperglycemic events (n = 4). The asterisk and the double cross indicate significant statistical difference based on two-tailed student’s t-test (p < 0.05, a = 0.05) between the treated group in the presence of hyperglycemic events and the control group and between the two treated groups respectively.

