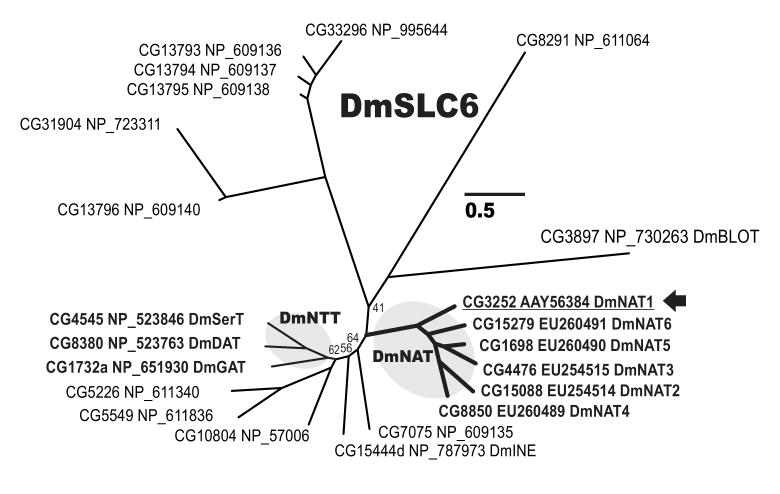
Figure 1. Evolutionary relationships of fruit fly SLC6 members.
The Bayesian tree of 22 Drosophila SLC6 members. Leaves are Drosophila gene names (CG) followed by predicted (NP) or cloned protein (AAY or EU) accession numbers. The arbitrary nomenclature is shown for NATs and certain neurotransmitter transporters. Posterior probabilities equal to 100% are omitted and < 100% are reported near specific nodes. The bar scale reflects evolutionary distance in substitutions per site.

