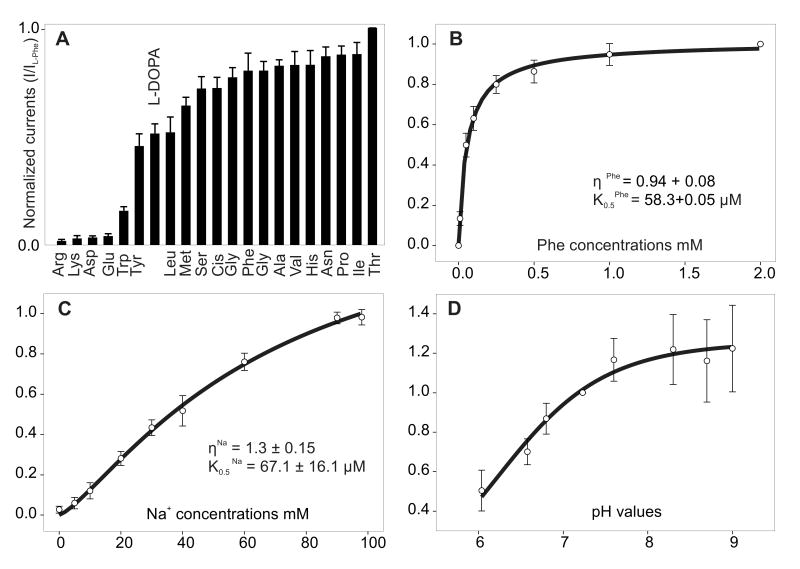
Figure 4. Substrate spectrum and kinetic properties of DmNAT1.
A. L-substrate evoked a current profile of DmNAT1. 1 mM final substrate concentrations were applied at a -50 mV holding potential. Maximum induced current values were normalized to the current evoked by L-threonine. Data are means ± SEM; n ≥ 3 recordings for at least three different oocytes for each data point. B. Phenylalanine-evoked currents as a function of substrate concentration. C. Phenylalanine-evoked currents as a function of cotransported ion concentration. Substrate saturation of kinetic constants determined upon application of different concentrations of Phe and Na+ (substitution with NMDG) at the -50 mV holding potential are shown. D. pH-dependent kinetics of phenylalanine-induced currents. Data are currents measured at increasing values of pH ranging from 6.0 to 8.7 and are means ± SEM for at least 3 oocytes per experiment per data point. Data from different oocytes were normalized in each group relative to values at pH 7.23.

