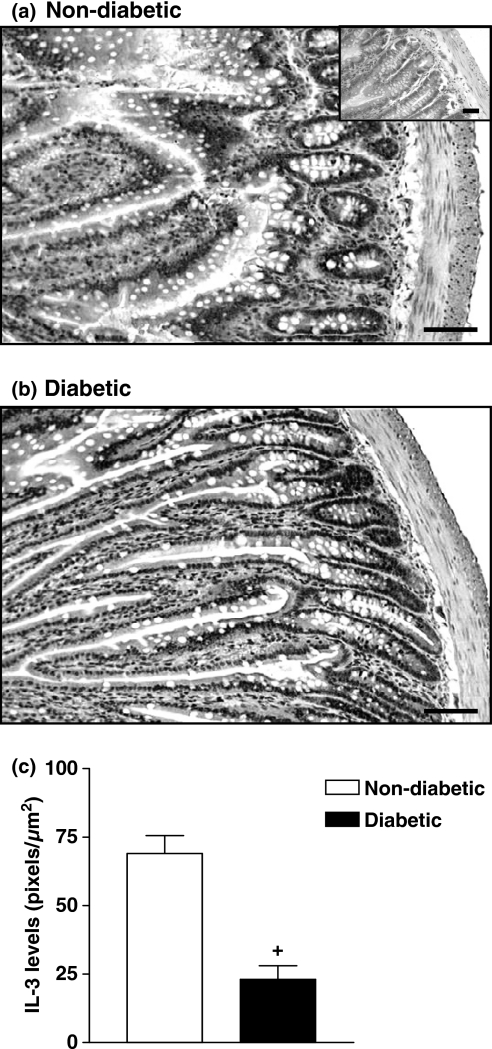
Figure 2.
Decrease in IL-3 expression in the intestine of diabetic rats. Panels (a) and (b) show photomicrographs of immunostaining of IL-3 of intestine sections from non-diabetic and alloxan-diabetic rats respectively. Insets represent negative controls when an irrelevant biotinylated goat anti-hamster IgG was used as primary antibody. Sections were counterstained with Harris haematoxylin. Bar 0.1 μm. Quantitative evaluation of IL-3 labelling is seen in panel (c). Data are expressed as mean ± SEM from four animals. The data are representative of two experiments. +P < 0.05 compared with non-diabetic rats.

