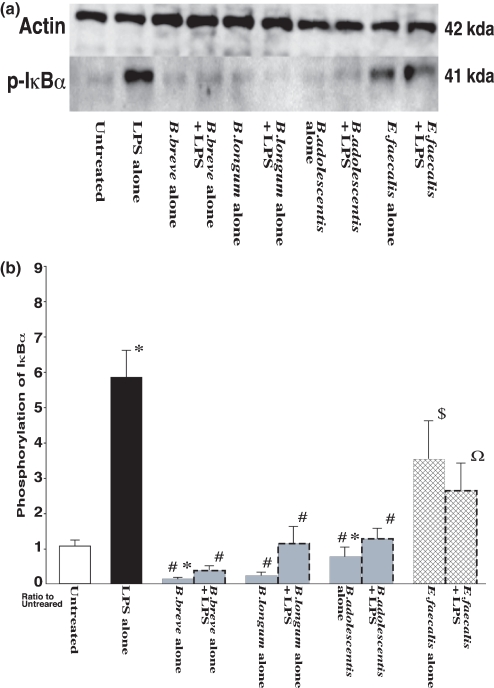
Figure 4.
(a) Phosphorylation of IκB-α in RAW264.7 cells after exposure to LPS and effects of Bifidobacterium species and Enterococcus faecalis. RAW264.7 cells were exposed to each species of living bacterial cells in condition medium with or without LPS (1 μg/ml) for 16 h. Proteins (50 μg/lane) of total cell lysates were separated by SDS–PAGE, transferred to a nitrocellulose membrane, and then incubated with specific antibodies against actin as confirmation of equal loading of crude protein levels (upper blot) and phospho-IκBa (lower blot). (b) The detected bands were quantified using LAS-3000. The IκB-α phosphorylation level in the negative control (untreated RAW264.7 cells) was assigned as 1.0, and results are expressed as mean ± SEM (n = 10). *P < 0.05 vs. negative control (untreated RAW264.7 cells); #P < 0.05 vs. LPS alone; $P < 0.05 vs. exposure to each of the bifidobacteria alone; ΩP < 0.05 vs. exposure to each of the bifidobacteria combined with LPS.

