
Fig. 3. Schematic of transgenes and bioluminescence of offspring representing the two enhancers.
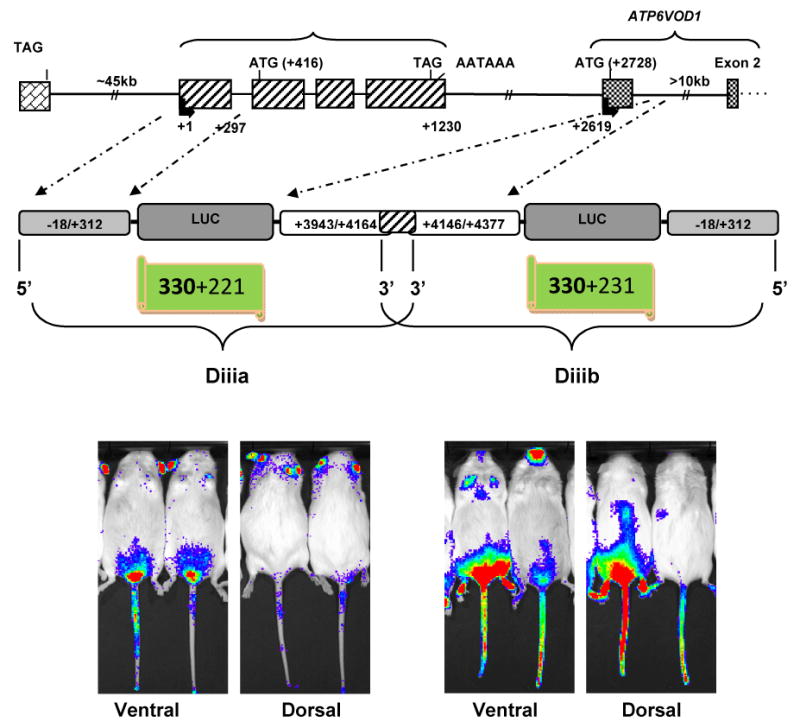
The upper panel shows a schematic of the AgRP-ATP6V0D1 locus. The middle panel shows schematics of the two constructs (Diiia & Diiib) that were used to make the transgenic mice. The transgene for enhancer Diiib is shown in the reverse orientation (3′ to 5′) so that its exact physical position is represented in the middle panel. The 18 nt overlap of the two enhancers is shown by the shaded region. The bottom panel shows bioluminescence images of dorsal and ventral views from second generation transgenic mice. Images of offspring from the same founder are shown for enhancer Diiia (left, bottom). Images from offspring from two different founders are shown for enhancer Diiib (bottom, right).