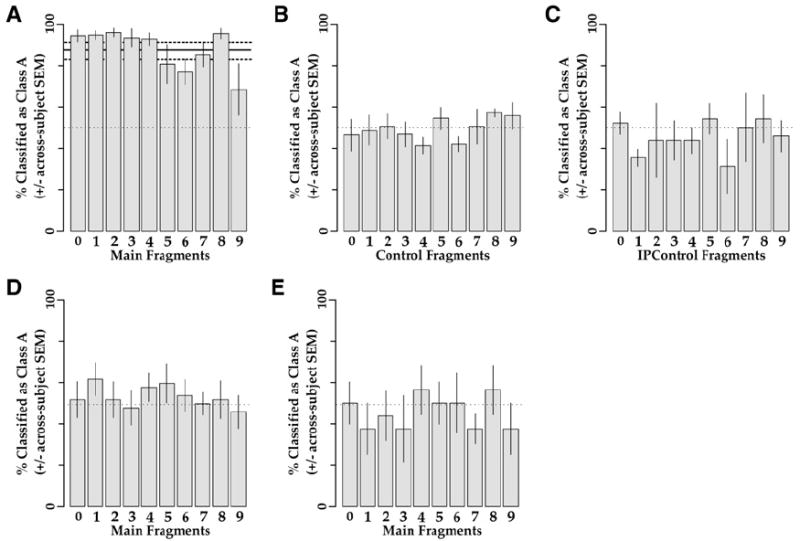
Figure 4. Classification Performance Using Fragments.

In each panel, each bar shows the average percentage (±SEM) of trials in which the subjects classified a given fragment as belonging to class A. The thin dotted line denotes 50%, or chance level performance. The thick black lines in the background in (A) denote the mean (solid line) and the SEM (dashed lines) of the subjects using whole objects during the last two sessions of training.
(A and B) Performance in experiment 1a (six subjects) with main fragments (A) and control fragments (B).
(C) Performance in experiment 1b with IPControl fragments (three of the six subjects). The IPControl fragments are shown in Figure S2. The performance with main fragments from experiment 1b is shown in Figure S3.
(D) Performance with main fragments without prior training. Subjects were tested with the same paradigm as above, but without any prior training in the categorization task. The data are averaged from six subjects.
(E) Testing with irrelevant training. Data are shown from one subject. The subject was trained in a similar, but irrelevant, categorization task and tested with the main fragments with the same paradigm as above.
