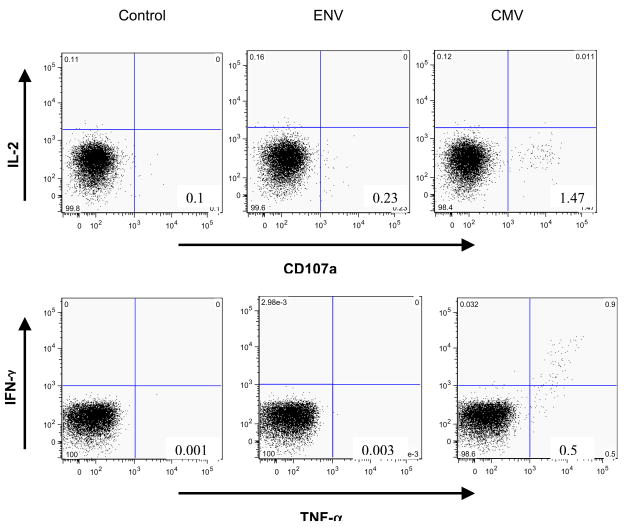
Figure 3.
Representative plots of antigen-specific CD8+ T cells in a vaccine responder. PBMC were stimulated with Env or CMV peptides then stained with anti-CD107a PE, anti-IFN-γ FITC, anti-TNF-α PE-CY7, anti-CD4 PerCP-Cy5.5 anti-IL-2 APC, anti-CD3 AmCyan and anti-CD8 APC-Cy7, and analyzed by flow cytometry. Samples were first gated on the CD3+/CD8+ lymphocyte population then the percent of CD107, TNF-α, IFN-γ, and IL-2 positive CD8+ T cells were determined.

