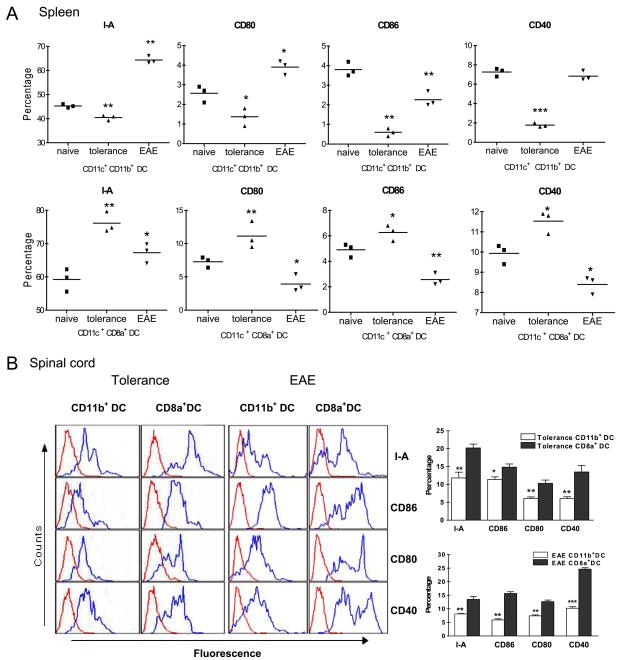
FIGURE 3.
Expression of I-A and costimulatory molecules on CD11b+CD11c+ DC, CD8α+CD11c+ DC subsets of EAE and i.v. tolerized mice. A, Flow cytometric analysis of cell surface markers on freshly isolated MNCs. Splenocytes of EAE mice or MOG35–55 i.v. tolerized mice were isolated on day 21 p.i. and stained for the expression of I-A, CD86, CD80 and CD40 on CD11c+CD11b+ DCs and CD11c+CD8α+ DCs.*, p < 0.05;**, p < 0.01;***, p < 0.001. B, Flow cytometric analysis of surface markers on freshly isolated CNS cells from PBS i.v. EAE mice or MOG35–55 i.v. tolerized mice. Cells were stained for expression of I-A, CD86, CD80, and CD40 on CD11c+CD11b+ and CD11c+CD8α+ DC subsets. Blue histogram lines represent specific fluorescence for indicated cell surface markers and red histogram lines represent cells stained with isotype-matched control mAbs.*, p < 0.05;**, p < 0.01;***, p < 0.001. One representative experiment of three is shown.

