
Figure 3.
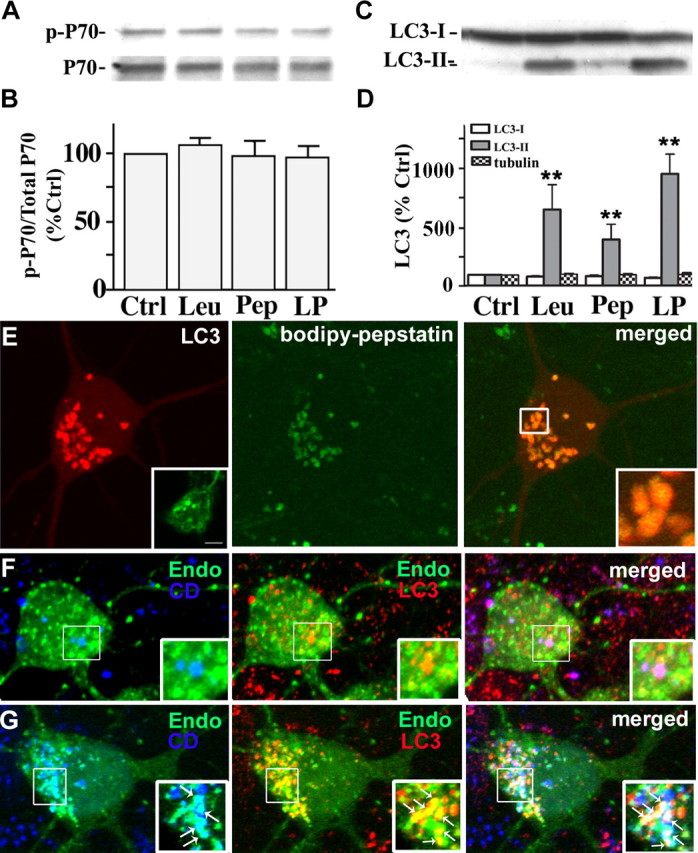
Cathepsin inhibition markedly elevates LC3-II levels without inducing mTOR-mediated autophagy. A, Immunoblot analyses of phospho-p70 and total p70 after leupeptin (20 μm), pepstatin (20 μm), or both (LP) were added to the medium for 24 h. B, Densitometric analyses of gels in A (n = 5): ratios of phospho-p70 relative to total p70 are expressed as a percentage of the untreated control value. Error bars indicate SEM. C, Immunoblot analyses of LC3-I and LC3-II after neurons were exposed to protease inhibitors for 24 h. D, Densitometric analyses of LC3-I, LC3-II, and tubulin immunoreactivity in neurons after protease inhibitor treatment (n = 5; **p < 0.01). E, Live image of DsRed-LC3 transfected neurons treated with leupeptin (20 μm) for 24 h loaded with BODIPY-pepstatin-FL. Vesicular LC3 localizes within BODIPY-pepstatin-positive compartments: lack of degradation results in a strong LC3 signal (E, right panel inset). Neurons treated with leupeptin and pepstatin for 24 h immunostained for LC3 show a similar pattern of punctate LC3 accumulation (E, left panel inset). F, GFP-Endomarker transfected neurons immunostained with LC3 (red) and cathepsin D (blue). Under normal conditions, LC3 and GFP-Endo occasionally colocalize (F, middle panel inset), whereas endosomes and cathepsin D do not (F, left panel inset). Cotreatment with leupeptin and pepstatin causes accumulation of LC3- and GFP-Endomarker-positive amphisomes (G, middle panel, arrows), as well as GFP-Endomarker and cathepsin D-positive endosomes and lysosomes.