
Figure 8.
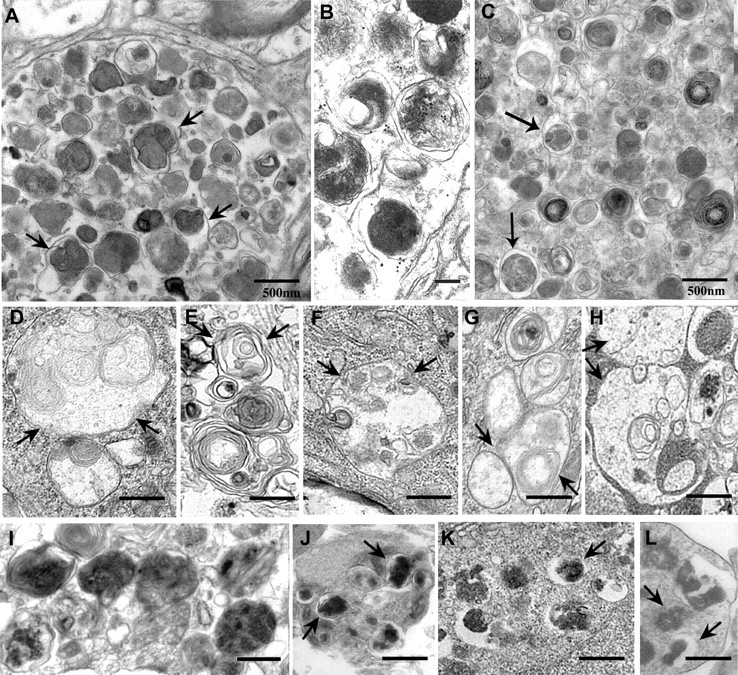
A–C, Comparison of AV ultrastructure in Alzheimer's disease and treated primary neurons: In the brains of patients with Alzheimer's disease (A, B) or the brain of a PS/APP mouse model of AD (C), dystrophic neurites in cerebral cortex contain robust accumulations of single- and double-membrane-limited AVs with electron-dense content, which contain cathepsin D (B). D–L represent the internal morphology of primary neurons during different autophagy modulating conditions. D and E depict conditions in which autophagy is strongly induced: cell body (D, F) and neurite (E) of rapamycin (10 nm; 24 h)-treated neurons; cell body (G) of EBSS-starved neurons (24 h). H depicts autophagosomes in perikarya after 1 h vinblastine treatment in which autophagosome fusion with lysosomes are severely impaired. I–L depict conditions involving impaired AV clearance illustrating AV morphologies resembling those in AD brain: cell body of vinblastine (10 μm)-treated neurons for 6 h (I, J); cell body (K) of EBSS plus pepstatin (20 μm; 24 h)-treated neurons; cell body (L) of leupeptin (20 μm; 24 h)-treated neurons. Arrows indicate different AV morphologies seen in each treatment. Scale bars, 500 nm.