Abstract
Salinity stress is one of the major factors which reduce crop plants growth and productivity resulting in significant economic losses worldwide. Therefore, it would be fruitful to isolate and functionally identify new salinity stress-induced genes for understanding the mechanism and developing salinity stress tolerant plants. Based on functional gene screening assay, we have isolated few salinity tolerant genes out of one million Escherichia coli (SOLR) transformants containing pea cDNAs. Sequence analysis of three of these genes revealed homology to Ribosomal-L30E (RPL30E), Chlorophyll-a/b-binding protein (Chla/bBP) and FIDDLEHEAD (FDH). The salinity tolerance of these genes in bacteria was further confirmed by using another strain of E. coli (DH5α) transformants. The homology based computational modeling of these proteins suggested the high degree of conservation with the conserved domains of their homologous partners. The reverse transcriptase polymerase chain reaction (RT-PCR) analysis showed that the expression of these cDNAs (except the FDH) was upregulated in pea plants in response to NaCl stress. We observed that there was no significant effect of Li+ ion on the expression level of these genes, while an increase in response to K+ ion was observed. Overall, this study provides an evidence for a novel function of these genes in high salinity stress tolerance. The PsFDH showed constitutive expression in planta suggesting that it can be used as constitutively expressed marker gene for salinity stress tolerance in plants. This study brings new direction in identifying novel function of unidentified genes in abiotic stress tolerance without previous knowledge of the genome sequence.
Key words: abiotic stress, cellular stress response, chlorophyll a/b binding protein, Escherichia coli, fiddlehead, functional screening, pea cDNA library, ribosomal L30E, salinity stress, salinity tolerant genes
Introduction
The plants are sessile and therefore have to endure environmental abiotic stress challenges such as soil salinity, drought and cold temperatures.1 These abiotic stresses in fact are the principal cause of crop failure worldwide, decreasing average yields for most major crops by more than 50%.2 To overcome the sudden changes in these environmental conditions, plants have evolved a number of mechanisms that are more complex than those of other organisms.3 Although, each of these abiotic stresses may differ from each other physically and elicit a different set of responses from plants individually; but they may activate a common reaction in plants which ultimately leads to the plant stress tolerance. Out of these stresses, the salinity stress is one of the major causes that adversely affects crop productivity and quality.4 Due to high saline conditions, nearly all processes involving plant physiology and metabolism are affected and consequently a complex network of intracellular signaling starts which leads to the plant adapting to adverse environmental conditions. These adaptive changes take place at the transcriptional and translation level to ensure a high photosynthetic response under non optimal conditions of high salinity stress.
Although the plants may have unique stress adaptive mechanisms to combat various stresses, the basic cellular stress response (CSR) mechanism which gets activated in response to stress are similar in prokaryotes, lower eukaryotes and plants.5 When pre-treated at sub-lethal conditions, plants and other organisms activate the CSR mechanism, which helps them to withstand otherwise non-permissive hostile growth conditions. CSR targets a defined set of cellular functions, including protein chaperoning and assembly, DNA and chromatin stabilization, cell cycle control, repair and removal of damaged proteins and certain other aspects of cell metabolism.5 With respect to the salt stress, plants are sensitive to the sodium ion concentration as it may prove to be toxic to the plant cells. CSR also provides increased tolerance to a stress when a plant has been previously exposed to another stress which might not be directly related to the previous one.6 As the cellular adaptive mechanisms are conserved and have a definite role to play in salinity stress, therefore, it can be assumed that plant stress genes can be screened functionally by their random overexpression in simple organisms. There are reports of functional screening of the plant stress genes by their random overexpression in yeast,7–9 and E. coli.10,12 It has also been demonstrated that the overexpression of some stress-induced genes confers increased plant stress tolerance.13 Moreover, the comparison of stress susceptible and tolerant plant genotypes by microarray analysis supports the evidence that differences in stress tolerance are mainly due to a higher constitutive expression of several stress-related genes rather than de novo gene transcription.14,15
The isolation and identification of new salinity stress induced genes, whose functions is yet to be correlated with the stress tolerance in plants, will be useful in developing salinity stress tolerant crop plants. Therefore, the aim of the present study is to isolate some of the unidentified genes that may have a role in salinity stress from plants like pea (Pisum sativum), whose genome has not yet been sequenced. We therefore constructed a pea cDNA library and undertook functional screening for gene mining, using E. coli as the host organism. A number of clones were identified and three clones namely, pea Ribosomal protein-L30E (PsRPL30E), chlorophyll-a/b-binding protein (PsChla/bBP) and FIDDLEHEAD (PsFDH) were analyzed for their role in stress tolerance which has not been elucidated earlier. In planta, the expression profile of PsRPL30E and PsChla/bBP showed upregulation in response to salt stress while the expression of PsFDH remained unchanged in stress conditions with respect to the control.
Results
Random overexpression of P. sativum cDNAs and their screening for salt tolerance in E. coli.
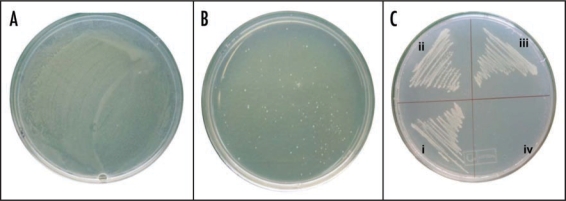
Phagemids derived from a cDNA library of stressed seedlings of P. sativum were transformed in E. coli cells. A total of over one million recombinant bacterial cells (SOLR E. coli cells) were selected on a medium supplemented with NaCl concentrations not permissive for bacterial cell growth. For control, the same numbers of cells were grown on LB medium (171 mM NaCl) and the result showed a lawn of colonies on the plate (Fig. 1A). When same number of cells was plated using 0.4 M and 0.6 M NaCl, the number of colonies reduced to ∼1,500 and ∼500, respectively (data not shown). At 0.8 M NaCl concentration, only a few healthy colonies grew (Fig. 1B). Plasmid DNA was isolated from the positive colonies and the inserts ranging in size from 300 to 2,000 bps were sequenced. Three healthy growing bacterial colonies (at 0.8 M NaCl) were selected for further studies. The salinity tolerance of these three colonies was further confirmed using another strain of bacteria in the subsequent section. BLASTX sequence analysis (Table 1) revealed homology with genes from other plant species whose function in salinity stress has not previously been elucidated and accordingly these genes were named RPL30E, ChlabBP and FDH. One clone PsFDH was partial from the 5′ end but still could give salt resistance in bacteria. The other two clones, PsRPL30E and PsChla/bBP, were full length and could give salt resistance to bacteria. The detailed analysis of these clones has been described in the following sections.
Figure 1.
Functional screening for salt tolerant genes from Pisum sativum using E. coli system. A total of over one million recombinant E. coli cells were selected on medium supplemented with NaCl concentrations not permissive for bacterial cell growth. (A) In control conditions the recombinant E. coli cells were grown on normal LB medium (171 mM NaCl) and the result showed a lawn of colonies on the plate. (B) At 0.8 M NaCl concentrations, about very few healthy colonies were observed. (C) All the three gene transformants grew well at 0.8 M stress (i–iii) while empty pbluescript vector transformant (iv) did not grow at all.
Table 1.
Summary of salt tolerant genes
| Clone no. & name | Accession number | Size (bps) | Homologous to | E-value | Plant species | Conserved motif |
| 1. PsRPL30E | EU041721 | 336 | Ribosomal protein L 30 | 2e-58 | Medicago sativa | Ribosonal protein |
| 2. PsChla/bBP | EU041720 | 798 | Light harvesting Chl a/b binding protein | 1e-152 | Pisum sativum | Chl a/b protein |
| 3. PsFDH | EU041722 | 1605 | Fiddlehead like protein | 1e-174 | Gossypium hirsutum | Chalcone synthase |
P. sativum ribosomal protein-L30E (PsRPL30E).
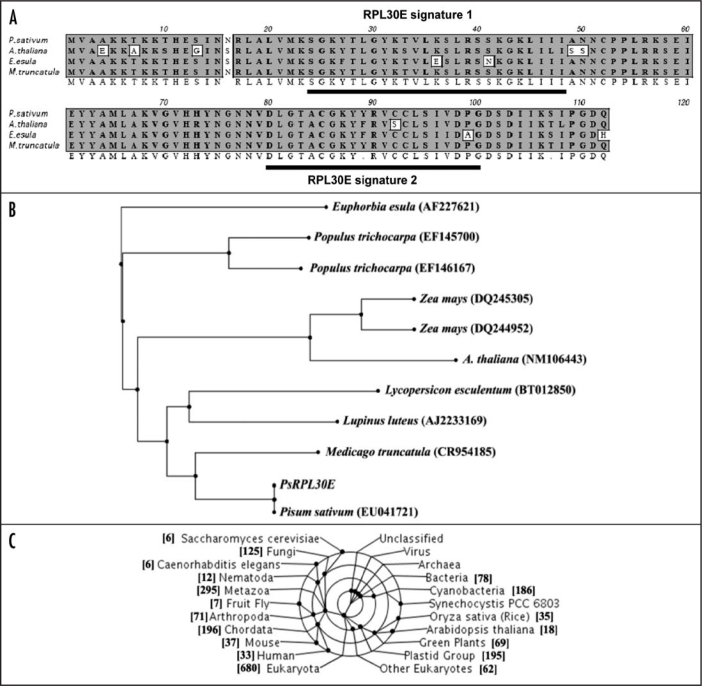
The cDNA of PsRPL30E encodes a full-length gene, which is 339 bps in size. The deduced amino acid sequence revealed a protein consisting of 112 amino acids with a predicted molecular mass of 12 kDa and a pI of 9.58. The domain search analysis of pea ribosomal protein L30E revealed that the protein contained mainly two domains: Ribosomal protein L30E signature 1 spanning from amino acids 24 to 48 and ribosomal protein L30E signature 2 spanning amino acids 80–100. The amino acid alignment of PsRPL30E with its corresponding units is shown in Figure 2A. The PsRPL30E is 99% identical to Medicago trunculata (ABPO2866), 93% identical to Euphorbia esula (AAF34766) and 97% identical to Arabidopsis thaliana (AAG51255). The deduced protein sequence identifies a region containing a protein motif closest to Ribosomal protein L30E signature 1 and Ribosomal protein L30E signature 2 (Fig. 2A). The phylogenetic analysis of PsRPL30E showed that it is closest to ribosomal protein from Medicago trunculata, A. thaliana and Lupinus luteus (Fig. 2B). The gene was found across the prokaryotes, lower and upper eukaryotes, plant and animal kingdom (Fig. 2C).
Figure 2.
The bioinformatical properties of P. sativum Ribosomal Protein L30E (PsRPL30E). (A) Alignment of the deduced amino acid sequence of the PsRPL30E with other plant homologues. GenBank accession nos. P. sativum (ABU75308), Medicago truncatula (ABPO2866), Euphorbia esula (AAF34766) and Arabidopsis thaliana (AAG51255). The underlined portion in the sequence identifies a region containing a protein motif closest to Ribosomal protein L30E signature 1 and Ribosomal protein L30E signature 2. (B) Phylogenetic tree of PsRPL30E. Dendrogram showing the phylogenetic relationship between the nucleotide sequence of PsRPL30E with other RPL30E. The names and accession numbers of the sources are mentioned in the figure. (C) Taxonomic coverage represents a taxonomic range of sequences associated with the sequence of reference. The figure shows that PsRPL30E that the gene is expressed across the prokaryotes, lower and upper eukaryotes, plant and animal kingdom.
P. sativum chlorophyll-a/b-binding protein (PsChla/bBP).
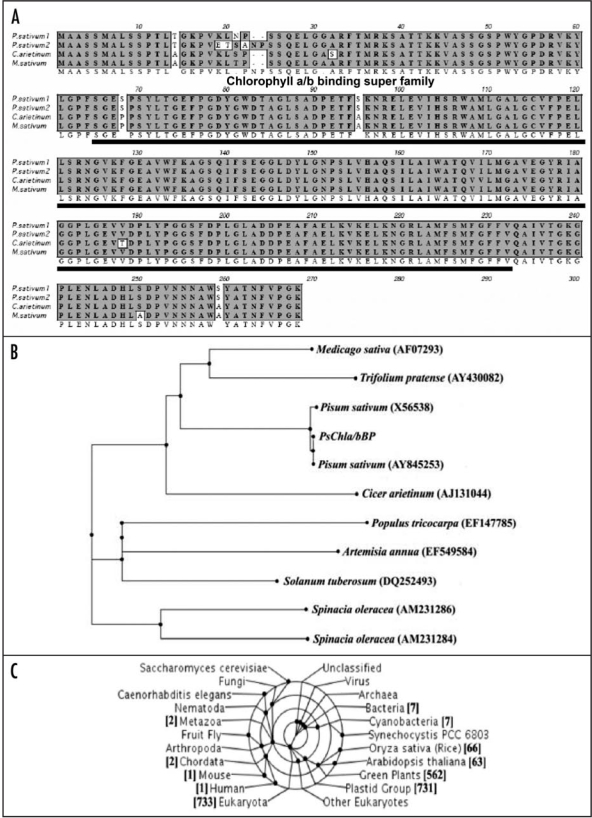
The cDNA of PsChla/bBP encodes a full-length cDNA of chlorophyll-a/b-binding protein (PsChla/bBP), which is 801 bps in size. The deduced amino acid sequence revealed a protein consisting of 266 amino acids with a predicted molecular mass of 28 kDa and a pI 5.47. The amino acid alignment of PsChla/bBP with its corresponding units is shown in Figure 3A. The PsChla/bBP is 99% identical to Pisum sativum (AAW31511) and 98% identical to Medicago sativum (AAC25775) and shares 97% identity to Cicer arieitnium (CAA10284). The deduced protein sequence identifies a region containing chlorophyll a/b binding super family spanning from 65 to 230 amino acids (Fig. 3A). Phylogenetic analysis of PsCBP showed that it is closest to chlorophyll-a/b-binding protein from Cicer arietinum, Trifolium pratense, Vitis vinifera and Populus tricocarpa (Fig. 3B). The PsChla/bBP protein was found to be highly conserved amongst the plant kingdom (Fig. 3C).
Figure 3.
(See previous page)The bioinformatical properties of Pisum sativum Chlorophyll a/b Binding Protein (PsChla/bBP). (A) Alignment of the deduced amino acid sequence of the PsChla/bBP cDNA with other plant homologues. GenBank accession nos. P. sativum (ABN49454), P sativum (AAW31511), Medicago sativum (AAC25775), Cicer arieitnium (CAA10284). The deduced protein sequence identifies a region containing Chlorophyll a/b binding super family. (B) Phylogenetic analysis of the of nucleotide sequence of PsChla/bBP. Dendogram showing the phylogenetic relationship between the nucleotide sequence of PsChla/bBP with other Chla/bBP. (C) Taxonomic coverage represents a taxonomic range of sequences associated with the sequence of reference. A taxonomic lineage analysis showed the protein is highly conserved amongst the plant kingdom.
P. sativum FIDDLEHEAD protein (PsFDH).
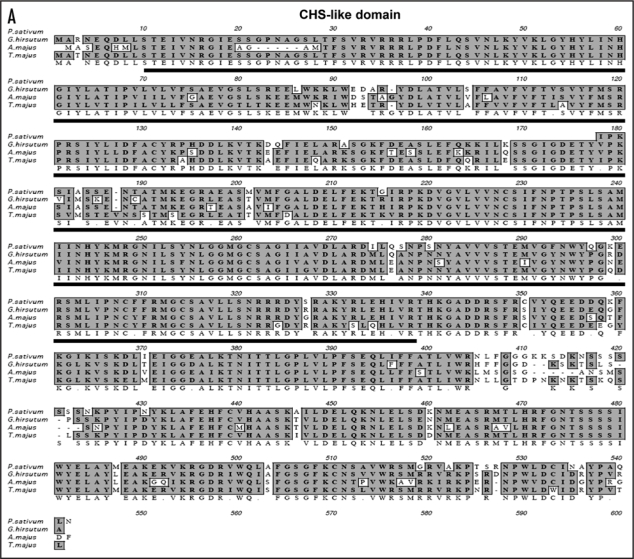
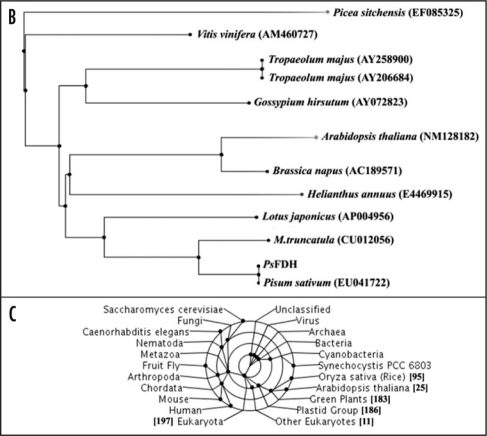
The cDNA homologue of FIDDLEHEAD gene from pea encodes a partial cDNA, which is 1,097 bps in size. Approximately 500 bps were missing from the 5′ end. The deduced amino acid sequence revealed a protein consisting of 364 amino acids with a predicted molecular mass of 40 kDa and a pI of 9.32. The domain analysis revealed that PsFDH contained the conserved chalcone synthase like (CHL) motif spanning from 10 to 339 amino acids (Fig. 4A). The amino acid alignment of PsFDH with its corresponding units is shown in Figure 4A. The PsFDH is 83% identical to Gossypium hirsutum (AAL67993) and Antirrhinum majos (CAC84082) and is 80% identical Tropaeolum majus (AA047729). A phylogenetic analysis (Fig. 4B) of Pea FIDDLEHEAD gene indicated that it is closest to FIDDLEHEAD from Medicago trunculata, Lotus japonicas and Helianthus annuus. Taxonomic lineage analysis revealed that the FIDDLEHEAD protein is highly conserved only in plant kingdom (Fig. 4C).
Figure 4.
The bioinformatical properties of P. sativum FIDDLEHEAD protein (PsFDH). (A) Alignment of the deduced amino acid sequence of the P. sativum FIDDLEHEAD cDNA with other plant homologues. GenBank accession nos.: P. sativum (ABU75309) Gossypium hirsutum (AAL67993), Antirrhinum majos (CAC84082) and Trapocolum majos (AAO47729). The underlined portion in the sequence contains the conserved chalcone synthase gene motif.
Figure 4.
The bioinformatical properties of P. sativum FIDDLEHEAD protein (PsFDH). (B) Phylogenetic tree of PsFDH. Dendrogram showing the phylogenetic relationship between the nucleotide sequences of PsFDH with other FDH. The names and accession numbers of the sources are mentioned in the figure. (C) Taxonomic coverage represents a taxonomic range of sequences associated with the sequence of reference. The figure shows that PsFDH protein is highly conserved only in plant kingdom.
Homology based modeling of PsRPL30E, PsChla/bBP and PsFDH.
The three dimensional modeling of proteins was done by taking the atomic coordinates of the proteins towards which the protein of interests exhibited maximum homology. Homology modeling of PsRPL30E using mammalian ribosomal 60S subunit protein as a template is shown as a ribbon diagram in Figure 5A. The modeled sequence showed maximum homology to chain 6 of 60S subunit within 80S complex of mammalian ribosome. Both the proteins showed presence of highly conserved ribosomal L7Ae/Gadd45 superfamily. Homology modeling of PsChla/bBP using major light harvesting complex of spinach as template is shown as a ribbon diagram in Figure 5B. The sequence showed maximum homology to 1RWT (chain A) which is a major light harvesting complex of spinach. Conserved domain, stretching from amino acid 65–231, search shows that the protein belongs to Chlorophyll A superfamily. The major part of the structure is composed of α helical strands. Homology modeling of PsFDH using chalcone synthase protein of Alfalfa as a template is shown as a ribbon diagram in Figure 5C. The sequence showed maximum homology with Chalcone synthase (Chain A) protein (gi: 5821988) of Alfalfa. It also showed presence of malonyl-CoA binding site. Amino acid 10–338 of PsFDH shows presence of conserved domain for condensing enzymes superfamily, which includes enzymes involved in synthesis and degradation of fatty acids and production of polyketides. Conserved domain search of the protein revealed three active sites (82, 262, 295), which are marked in the Figure 5C.
Figure 5.
Homology modeling of PsRPL30E, PsChla/bBP and PsFDH. Structural predictions was made using EsyPred 3D modeling programmer and visualized using Rasmol software. Ribbon diagrams of these Pisum sativum proteins have been done by taking the atomic coordinates of proteins towards which the protein of interests exhibits maximum homology. N denote for N-terminal and C denote for C-terminal of the protein (A) Homology modeling of PsRPL30E using mammalian ribosomal 60S subunit within 80S complex as template. From amino acid 24–48 show signature 1 stretch (white arrows), while from amino acids 80–100 show signature 2 stretch (green arrows). (B) Homology modeling of PsChla/bBP using major light harvesting complex of spinach as template. The structure is composed of twelve α helical strands which constitute the major part of it. (C) Homology modeling for PsFDH using chalcone synthase protein of Alfalfa as a template. Conserved domain search of the protein revealed three active sites (82, 262, 295) as marked in the figure.
Salinity tolerance by overexpressing PsRPL30E, PsChla/bBP and PsFDH in other strain of E. coli.
Since the role of all the above genes has not been well studied in salt stress, therefore an effort was made to further functionally validate all the three genes in another strain of E. coli (DH5α). For this the plasmids were purified from all the three clones (expressing in SOLR cells) and reintroduced into DH5α cells. Empty pBluescript vector SK(-) was used as a control. This excluded the possibility of unpredictable chromosomal mutations in SOLR cells, which might have provided salt tolerance. These overexpressing bacterial cells (DH5α) were induced by IPTG and were subjected to salt (NaCl) stress. In the solid medium all transformants grew on normal LB agar medium containing only 171 mM NaCl (data not shown). All the three gene transformant clones grew well at 0.8 M salt stress as shown in Figure 1C (i–iii), while the empty pBluescript vector DH5α transformant did not grow on 0.8 M NaCl (Fig. 1C, iv).
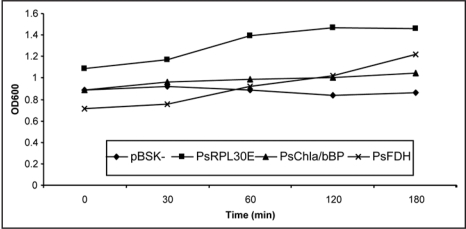
In a similar type of experiment, all the three gene transformants (overexpressing clones in E. coli [DH5α]) were also grown in liquid medium containing 0.8 M NaCl. Upon salt stress, cell survival rate (expressed as bacterial O.D.) is shown in Figure 6. In control cells (i.e., the cells transformed with the empty vector) the survival rate continued to decrease in response to NaCl. After 30 min of NaCl treatment, the growth of the bacterial cells overexpressing the genes was partially recovered. For clones PsRPL30E and PsChla/bBP the survival rate was maintained constant all through and went down only when approaching 180 minutes of incubation time. The growth pattern of bacteria overexpressing clone PsFDH showed a constant growth with increase in time. Although the bacterial O.D. increased initially it went down after 120 minutes. These data suggest that the gene product of PsRPL30E and PsChla/bBP may play a role in general cellular response to NaCl, conserved in prokaryotes and plants.
Figure 6.
Survival rate of E. coli DH5α transformants in liquid LB after NaCl treatment at various time intervals. PsRPL30E, PsChla/bBP and PsFDH cDNAs and the empty pBluescript SK(-) vector as control, were grown at 37°C up to 1.0 OD600 and then diluted to 0.1 OD600 with LB. Cell aliquots (1 ml) were taken after 0, 30, 60, 120 and 180 min. Cell survival was estimated by taking OD. The OD represents the mean of three replicates of at least two independent recombinant bacterial cultures.
Tissue specific and abiotic stress induced expression level of PsRPL30E, PsChla/bBP and PsFDH genes in plant.
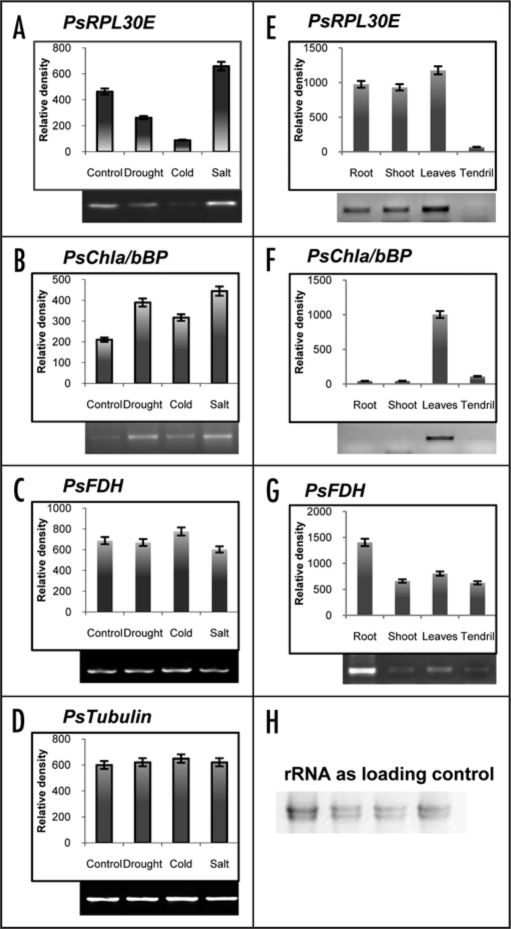
To analyze the expression of these genes in various plant organs and under abiotic conditions including various salt stress (NaCl, KCl and LiCl), the seven-day-old pea seedlings were given various treatments as mentioned in material and methods. Total RNAs were extracted from control and treated tissues and RT-PCR was done using gene specific primers. Tubulin was used as an internal control. Overall, it was found that all the three genes were induced in salt (300 mM NaCl) stress (Fig. 7A–C). In case of PsRPL30E the expression levels went down in cold and dehydration stress, but as compared to the control the transcript level increased in salt stress (Fig. 7A). For PsChla/bBP the expression levels went up in response to the dehydration stress as compared to the control, but the expression was found to be highest under salt (300 mM NaCl) stress (Fig. 7B). For PsFDH gene, there was no change in the transcript levels in all the stresses as compared with the normal conditions (Fig. 7C). The expression level of Tubulin did not change throughout the experiment (Fig. 7D). We also wanted to evaluate the expression profiles of these genes under different plant organ type. Therefore we processed the various plant organs as discussed in the material and methods. We found that the PsRPL30E showed high expression in root, shoot and leaves while low expression was observed in tendrils (Fig. 7E). In contrast the PsChla/bBP gene showed expression only in leaves (Fig. 7F). Finally the PsFDH showed expression in all the plant organs analyzed, but the highest was observed in roots (Fig. 7G). Figure 7H shows the rRNA as a loading control.
Figure 7.
Transcript levels of PsRPL30E (A and E), PsChla/bBP (B and F) and PsFDH (C and G) in response to stress and tissue specific expression. Tubulin gene (D) was used as an internal control. The total RNAs were extracted from seven day old pea seedlings after stress treatment. RT-PCR was done in triplicate to check the expression level of the transcripts. In the left panel lane 1 is the control without any treatment while lanes 2, 3 and 4 are the transcript levels after giving drought, cold and salt (300 mM NaCl) stress. In the right panel lane 1 is root tissue, lane 2 is shoot tissue, lane 3 is leaves tissue and lane 4 is tendril tissue. The upper panel shows the quantitative data, while the lower shows the RT results.
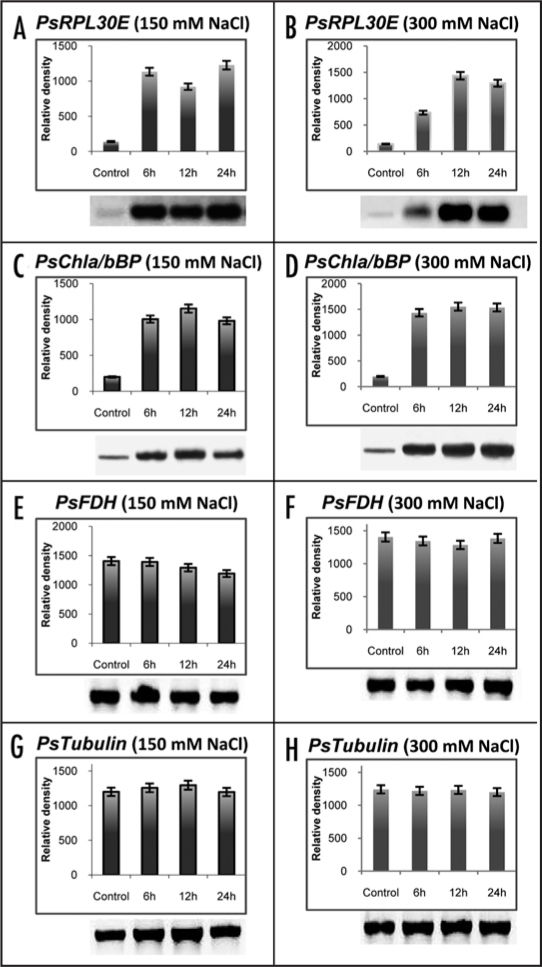
The three clones (PsRPL30E, PsChla/bBP and PsFDH), which were tested for their expression under NaCl stress, were further tested by the time kinetics for their salt inducibility (NaCl, KCl and LiCl) by RT-PCR. For this the 7- to 8-day-old pea seedlings were treated with 150 mM and 300 mM NaCl for variable time periods (6, 12 and 24 hrs) and their transcript levels were analyzed. The overall pattern of expression of all the three genes was found to be similar in response to 150 mM as well as 300 mM NaCl treatments (Fig. 8A–H). The expression levels in PsRPL30E at 150 mM NaCl showed upregulation upto four to five folds at 6 hrs as compared to the control at 0 hr, and did not show any further increase at 12 hr and 24 hr (Fig. 8A). However, at 300 mM NaCl there was threefold increase at 6 hr and a further two fold increase at 12 hr and 24 hr time point as compared to the control (Fig. 8B). At 150 mM and 300 mM NaCl concentrations the expression levels of PsChla/bBP gene showed 4 to 6 folds increased accumulation of transcript at 6, 12 and 24 hrs with respect to the control. (Fig. 8C and D). The PsFDH gene at 150 mM and 300 mM did not show any significant change in the transcript level as compared to the control (Fig. 8E and F). Tubulin was used as an internal control and its expression did not change throughout the experiment (Fig. 8G and H).
Figure 8.
Transcript levels of PsRPL30E (A and B), PsChla/bBP (C and D) and PsFDH (E and F) in response to 150 mM NaCl (left) and 300 mM NaCl (right) salt stress at various time intervals. Tubulin gene (G and H) was used as an internal control. The total RNAs were extracted from seven day old pea seedlings after stress treatment. RT-PCR was done in triplicate to check the expression level of the transcripts. In each of the left and right panel lane 1 is the control without any treatment while lanes 2, 3 and 4 are the RNA samples collected after 6, 12 and 24 hrs of stress treatments. The upper panel shows the quantitative data, while the lower shows the RT results.
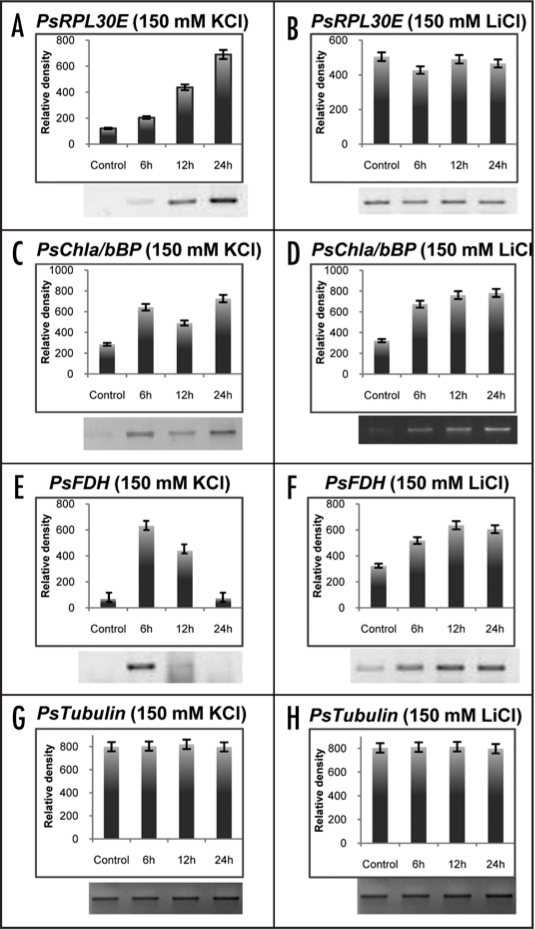
To check for the specific role of sodium ions in comparison to other ionic stressants (potassium and lithium ions) we analyzed the expression levels of PsRPL30E, PsChla/bBP and PsFDH genes under 150 mM KCl and 150 mM LiCl treatments to the pea seedlings for 6, 12 and 24 hrs. There was an overall increase in the expression pattern of all the three genes in response to the KCl stress (Fig. 9A–E). The expression levels in PsRPL30E increased gradually with increase in time but the overall increase was more than three fold at 24 hr time point (Fig. 9A). However, there were no changes in the expression levels of PsRPL30E at 150 mM LiCl stress (Fig. 9B). At 150 mM KCl and LiCl concentrations the expression levels of PsChla/bBP did not show any specific pattern of expression in transcript, although there was a general increase in the transcript level with respect to control (Fig. 9C and D). The PsFDH gene showed a threefold increase in the expression levels in response to KCl at 6 hr but the expression levels were lower at 12 and 24 hrs. In response to LiCl stress there was no significant change in transcript level of PsFDH gene (Fig. 9E and F) similar to the NaCl stress (Fig. 8E and F). Tubulin was used as an internal control and its expression did not change throughout the experiment (Fig. 9G and H).
Figure 9.
Transcript levels of PsRPL30E (A and B), PsChla/bBP (C and D) and PsFDH (E and F) in response to 150 mM KCl (left) and 150 mM LiCl (right) concentrations at various time intervals. Tubulin gene (G and H) was used as an internal control. The total RNAs were extracted from seven day old pea seedlings after stress treatment. RT-PCR was done in triplicate to check the expression level of the transcripts. In each of the left and right panel lane 1 is the control without any treatment while lanes 2, 3 and 4 are the RNA samples collected after 6, 12 and 24 hrs of stress treatments. The upper panel shows the quantitative data, while the lower shows the RT results.
Discussion
The mechanism of stress tolerance exists in all living systems with minor modifications from bacteria to higher plants. As abiotic stress ultimately affects the cellular gene-expression machinery, it is evident that a large number of genes are up or downregulated. Various methods like differential screening, differential display or microarray analysis have been employed to isolate and study the pleothora of genes involved in various abiotic stress signaling pathways.16–18 The mere induction of a gene in response to a particular stress necessarily does not implicate that a specific gene is necessary to impart stress tolerance. Therefore there is an urgent need to understand and execute functional approaches to ascertain whether or not that gene is contributing to increase in plant stress tolerance.19 It is believed that some cellular responses to salinity stress are conserved across the prokaryotes as well as the eukaryotes including plants. Experimentally also it has been proven that functionally analogous stress tolerant genes exist in both unicellular organisms and plants.19 Due to the similarity of the general cellular stress response in prokaryotes, lower eukaryotes and plants the importance of the role of these plant genes in salinity tolerance has been studied by their overexpression in simple organisms, such as yeast or bacteria.9–12,20,21
In the present study, we have isolated three salinity tolerant genes (RPL30E, Chla/bBP and FDH) from pea plant and identified their novel function in salinity stress tolerance in bacteria. The first gene, RPL30E, is an indispensable component of the eukaryotic 80S ribosome, where it is part of the large (60S) ribosomal subunit. Its role in stress has not been well studied. Here we identified that PsRPL30E confers the high salinity tolerance to bacteria and its expression levels go up by high salinity stress in plants but remained unchanged in drought stress. In fact its expression goes down in cold stress as compared to the unstressed plants. Since the ribosomal structure between prokaryotes and eukaryotes is different, the expression of this protein may not be playing a role via translation process but may confer tolerance via a pathway yet to be elucidated. As we know that there is always a cross-talk between the stresses,3 therefore, resistance to one abiotic stress may confer cross tolerance to several other stresses.1,21 The data presented here show that the salinity-induced genes (PsChla/bBP and PsFDH) may also be responsible for giving cold or drought stress tolerance. It has also been reported that overexpression of tomato and Arabidopsis dehydrins enhances salt and cold tolerance in plants22 as well as in yeast.23 A ribosomal 60S subunit homologue of yeast is known to respond salt stress. Yeast ribosomal protein genes were induced at 10 and 30 min by more than 2.0-fold under salinity stress of 2 M, which supports the role of PsRPL30E gene in salinity stress tolerance.24 The above observations suggest that this gene represents new salinity tolerant candidate from P. sativum, which may shed light on novel mechanism of salinity tolerance in plants.
The second gene, PsChla/bBP, is a photosynthesis related gene, whose encoded protein can switch between light-harvesting antenna for photosystem I (PS I) or photosystem II (PS II), in order to maintain an optimal excitation balance.25 The present study has shown that this gene could also confer salinity stress tolerance in bacteria, although the functions of photosynthesis related proteins in non-photosynthetic bacteria is unknown. However, certain researchers have isolated a cDNA clone for light harvesting protein from seaweed that could confer salinity tolerance to bacteria.26 In one of the microarray study of rice the Chla/bBP was reported to differentially regulated by salt stress.27 Role of LHCB5, a light harvesting complex of PS II of Arabidopsis thaliana, has been reported to be involved in ionic and osmotic stress.26 In this study a significant increase at the transcript level was also observed in pea plants in response to salinity, cold and drought stresses. From our findings and those reported by others28 that Chla/bBP is one of the putative salinity tolerant genes in mangrove plant, we conclude that PsChla/bBP is an abiotic stress regulated gene and could be used for raising salinity tolerant transgenic plants. At present it is difficult, however, to comment on how this protein confers tolerance to bacteria. May be these affect overall protein stability. This need to be tested in future studies.
The product of third salinity tolerant gene, FDH, is probably involved in the synthesis of long-chain lipids found in the cuticle and shows similarity to a large class of genes encoding proteins related to beta-ketoacyl-CoA synthases and chalcone synthases.29 The FDH gene is also involved in epidermal cell interactions, blocking organ fusion at early stages of development as well as in pollen growth. FDH-like genes may directly facilitate cell-cell interactions that need to occur during carpel fusion and pollen tube growth.30 Twenty genes similar to FDH have been identified in Arabidopsis genome. The PsFDH isolated in the present study gave salinity tolerance to the bacteria, but its transcript level in plants was high and remained same in normal and abiotic stress conditions. The above result gives us the possibility that there might be some genes, which are precommited to tolerate abiotic stress and their transcript levels are already high in unstressed conditions.31,32 Analysis of conserved domains of PsFDH also supports this data. Chalcone synthase catalyzes first reaction of anthocyanin biosynthesis by carrying out condensation reaction of 4-coumaroyl-CoA and malonyl-CoA, to form naringenin chalcone.33 Anthocyanin biosynthesis pathway is involved in hydrogen peroxide regulated stress perception and signal transduction pathway.34 Also, anthocyanin biosynthesis is a characteristic response to salt stress induction.35 Presence of both malonyl-CoA binding site and chalcone synthase like domain suggests the role of PsFDH in biosynthesis of anthocyanin or similar stress protective pigments. Since the PsFDH is showing similar expression in stress and normal conditions, therefore, it can also be used as a constitutively expressed marker gene especially for salinity stress tolerance. These results also supported the notion that a higher constitutive expression of several stress genes is crucial for plant stress tolerance rather than their de novo transcription.18
Our understanding of the quantitative effect of different experimental factors on the plant transcriptome revealed the key role of various ionic stressants and organ developmental processes for establishing mRNA levels throughout the plant. This process in turn determines how cells, organs and tissues respond to exogenous cues. The PsRPL30E gene showed same level of expression in root, shoot and leaves, however, in tendrils the expression level was very low. The PsChla/bBP gene showed high level of expression only in leaves. The PsFDH gene showed high level of expression only in roots. The data indicate that the expression pattern of our genes of interest (PsRPL30E, PsChla/bBP and PsFDH) showed tissue specificity.
We also explored the salt-stress induction dependence of these proteins by treating the pea seedlings with lower NaCl (150 mM) concentration. We found that the general pattern of expression of PsRPL30E, PsChla/bBP and PsFDH genes was same as compared to 300 mM NaCl concentrations. To check for the specificity of Na+ ion induced salinity stress we also treated the pea seedling with other ionic stressants like KCl and LiCl for different time periods. We observed that there was no significant effect of Li+ ion on the expression level of these genes, while an increase in response to K+ ion was observed. In this study we observed that the effect of Na+ ion was significantly more as compared to K+ ion. This showed that there is a general ionic effect on the expression of these three genes. However, the two genes (PsRPL30E and PsChla/bBP) respond differently with Na+ ion as compared to PsFDH.
These genes represent new salinity tolerant candidates from pea, which may shed light on novel mechanism of stress tolerance. Structural and conserved domain searches have further confirmed role of these genes in salt stress tolerance. Overall, this study shall provide a significant contribution for our better understanding of stress tolerance in plants. It remains to be tested whether the expression of these genes will confer durable resistance to high salinity tolerance in crops, but the successful identification of these salinity stress induced genes reveals a clear pathway for the direction for further experimentation.
Materials and Methods
Plant material, growth condition and stress treatment.
Pea seeds were surface-sterilized in a solution of Clorox plus 0.05% Triton X-100 for 10 min, washed with sterilized water three times and imbibed in sterilized water for at least 4 h. These presoaked seeds were grown under controlled conditions (14/10 h light/dark) in white light at an intensity of 100 µmol m−2 s-1 PAR in vermiculite moistened with tap water or on wet germination paper (for treatment) under a 14/10-h light/dark cycle at 25°C for 7 days. Seven days old pea seedlings were provided with different stress conditions. The individual stress treatments given were as follows. For the cold treatment, the seedlings were grown under continuous white light and were transferred to the 4°C cold chamber. For drought treatment, the seedlings were carefully removed and dehydrated on the filter paper as described by Yamaguchi and Shinozaki.36 For the salt treatment the roots of the seedlings were dipped at 150 mM NaCl concentration. The abiotic stresses given to the pea seedlings were given for six hours each. For time kinetics studies the uniformly developed seedlings were transferred into medium either containing indicated concentrations of 150 mM or 300 mM NaCl, 150 mM KCl and 150 mM LiCl. The stress treatment given was for zero, 6, 12 or 24 hrs each. For organ specific expression the pea plant parts roots, stems, leaves and tendril were harvested directly into liquid nitrogen and stored at −80°C for later use. The control plants were kept at 25°C in growth chamber under constant light. Screening and functional analysis of plant stress-related cDNAs by their random expression in high salt concentrations has been described below.
cDNA library construction and functional screening.
A cDNA library was constructed from 5 µg of poly(A)+ RNA (isolated from apical leaves of 7-day-grown pea seedlings) in Uni-Zap XR vector using Zap-cDNA synthesis kit (Stratagene, La Jolla, CA) following the manufacturer's protocol. The resulting phage library contained 1 × 10⁹ plaque forming units/ml. The insert size of library ranged from 500 bps to 2,000 bps. Using an in vivo excision system the library was converted to phagemids and transferred in SOLR E. coli cells, according to the manufacture's protocol (Stratagene, La Jolla, CA, USA). Incubation times for mass excision were kept strictly as per the manufacturer's protocol so as not to alter clonal representation.
Plasmids (pBluescript SK-) containing cDNA inserts were mass-excised from phage stock of the P. sativum cDNA library using ExAssist helper phage and propagated in SOLR E. coli cells (Stratagene, USA) according to the manual provided by the manufacturer. The cDNAs of P. sativum were cloned downstream of the lac promoter of pBluescript plasmids thus allowing the expression of recombinant proteins upon isopropyl-beta-D-thiogalactopyranoside (IPTG) induction. Over one million E coli recombinant cells from the same bacterial culture were plated on LB agar containing 50 µg/ml kanamycin, 50 µg/ml ampicillin, 1 mM IPTG and increasing concentrations of salt such as 0.4 M, 0.6 M and 0.8 M NaCl (concentration not permissible for the host bacterial growth). As a control the cells were also grown in the above medium with no extra salt included. The plates were kept on incubation of the plates at 37°C for 12 to 16 hrs.
Bacterial clones that were able to grow on LB plates supplementing with 1 mM IPTG and 800 mM NaCl at 37°C were isolated and streaked on the same medium to confirm their abilities to tolerate high concentration of salt. E. coli cells with pBluescript empty vector were used as negative controls. To further confirm the effective contribution of these three plant cDNAs to survival of bacteria under high NaCl concentration and to exclude any association of the observed phenotype with unpredictable chromosomal mutations, the plasmids were purified from these overexpressing colonies (SOLR) and reintroduced into a different E. coli strain (DH5α). The plasmids from positive colonies were sequenced and further characterized.
DNA sequencing and analysis.
cDNAs from plasmids were sequenced on both strands by the dideoxy chain termination method using Sequenase Version 2.0 (US Biochemicals, Cleveland, OH, USA). The clones of the expression library were found to be in frame with the LacZα gene which is driving expression in Bluescript plasmid. Sequences were compared to GenBank database, using BLASTN or BLASTX software (BLAST 2.0). The deduced amino acid sequences of cDNAs and other plant homologues were aligned using the CLUSTALW algorithm. The sequences were exposed to protein motif analysis software (InterProScan) and the protein motifs were deduced. Since the functional analysis of the genes was done in the bacterial system, therefore the taxonomic coverage was done, especially with reference to plants and bacteria.
Phylogenetic analysis.
The amino acid sequences of PsRPL30E, PsChla/bBP and PsFDH and their homolog in higher plants were aligned using the CLUSTALW algorithm37 and phylogenetic analysis was conducted with the Fast minimum evolution method.38
Homology based protein modeling.
To create homology based protein models automated homology modeling program ESyPred3D (http://www.fundp.ac.be/sciences/biologie/urbm/bioinfo/esypred/) was used. The method uses neural networks for increased alignment performance. The program works by combining, weighting and screening the results of several multiple alignment programs, thus is bound to give a true picture. The final three dimensional structures were built using special software named RasMol (http://www.openrasmol.org/). RasMol is a molecular graphics program intended for the visualisation of proteins, nucleic acids and small molecules. The program reads in molecular coordinate files and interactively displays the molecule on the screen in a variety of representations and colour schemes. Further conserved domain search of the proteins, to validate the protein models, was done using NCBI's conserved domain search tool (http://www.ncbi.nlm.nih.gov/Structure/cdd/wrpsb.cgi).
Survival of recombinant bacterial cells at high NaCl concentration.
About one million recombinant E. coli cells transformants expressing the P. sativum proteins were obtained and plated on a LB-agar plate supplemented with 50 mg/ml−1 ampicillin, 2% glucose and 1 mM IPTG and varying amount of salt concentration. The host strain was unable to grow under the salt-stress condition. As one more control, the transformants containing only the vector pBluescript (with no insert) were also grown in a similar condition. The bacterial plates were incubated overnight at 37°C. In order to further confirm the salinity tolerance, these clones were also grown in liquid LB media containing higher concentration of salt. Briefly, the recombinant E. coli DH5α cells transformed with plasmids carrying the PsRPL30E, PsChla/bBP and PsFDH cDNAs or with the empty pBluescript SK(-) as control, were grown at 37°C up to 1.0 OD600 and then diluted to 0.1 OD600 with LB medium, supplemented with ampicillin 50 mg/ml, glucose 2% and 1 mM IPTG. Three hours after IPTG induction (0.4–0.6 OD600), NaCl was added to a final concentration of 0.8 M. Cell aliquots (1 ml) were taken after 0, 30, 60, 120 and 180 min. Cell survival was estimated by measuring the OD. The OD represents the mean of three replicates of at least two independent recombinant bacterial cultures.
Transcript analysis.
Total RNA was extracted with TRIzol (Gibco-BRL, Gaithersburg, MD, USA) from the 7 days old pea seedlings exposed to different abiotic stresses (cold, salinity [300 mM] and drought). In another set of experiment, the time kinetics were performed by treating the pea seedlings at 300 mM salt and leaves were harvested at different time interval such as 0, 6, 12 and 24 hrs. For preperation of cDNA, approximately 5 µg of the total RNA from all the stressed and non stressed samples were reverse transcribed by using oligo(dT) primer and the first strand cDNA Synthesis Kit (Invitrogen, CA, USA). The RT-PCRs reactions were performed with gene specific primer sets (Table 1) following the recommended thermal profile: 95°C for 5 min, followed by 25 cycles of 95°C for 45 s and 60°C for 1 min and 72°C for 2 min The final extension was carried out at 72°C for 10 min. The P. sativum Alaska alpha-tubulin (TubA1) gene, PSU12589 was used as internal standard using tubulin gene specific primers (Table 2). The PCR products were separated on 1.2% agarose gel and quantified using ChemiDoc-XRS (Bio-Rad, USA). The transcript levels (DNA intensity ratio) were estimated by ChemiDoc-XRS (Bio-Rad, USA).
Table 2.
Oligonucleotides used in the study
| Number | Sequence | Remarks |
| 1 | 5′-CATATGGTTGCGGCAAAGAAGAC-3′ | PsRPL30E-F |
| 2 | 5′-CTCGAGTTACTGGTCACCGGGAA-3′ | PsRPL30E-R |
| 3 | 5′-GAATTCATGGCCGCTTCATCCATG-3′ | PsChla/bBP-F |
| 4 | 5′-CTCGAGTCACTTTCCGGGAACAA-3′ | PsChla/bBP-R |
| 5 | 5′-GATTATAGCCGCGCGAAGTATCGTC-3′ | PsFDH-F |
| 6 | 5′-CTGCTGCTAGAAGTGTTGCCGAATC-3′ | PsFDH-R |
| 7 | 5′-ATGAGGGAGTGCATTTCG-3′ | TubA1-F |
| 8 | 5′-CTAGTACTCTTCCTCACC-3′ | TubA1-R |
F, forward; R, Reverse.
Acknowledgements
We thank Drs. Sudhir K. Sopory and Renu Tuteja (ICGEB, New Delhi) for helpful comments/corrections. Work on plant stress tolerance in N.T.'s laboratory is partially supported by Department of Science and Technology (DST), Government of India and Department of Biotechnology (DBT), Government of India.
Abbreviations
- CSR
cellular stress response
- E. coli
Escherichia coli
- FDH
fiddlehead
- IPTG
isopropyl thio-β-D-galactoside
- Ps
Pisum sativum
- RPL30E
ribosomal-L30E
- Chla/bBP
chlorophyll-a/b-binding protein
Note
Sequence data from this article can be found in the EMBL/GenBank data libraries under accession numbers: EU041721 (PsRPL30E cDNA), EU041720 (PsChla/bBP cDNA) and EU041722 (PsFDH cDNA).
Footnotes
Previously published online as a Plant Signaling & Behavior E-publication: http://www.landesbioscience.com/journals/psb/article/8387
References
- 1.Zhu JK. Cell signaling under salt, water and cold stresses. Curr Opin Plant Biol. 2001;4:401–416. doi: 10.1016/s1369-5266(00)00192-8. [DOI] [PubMed] [Google Scholar]
- 2.Bray EA, Bailey-Serres J, Weretilnyk E. Responses to abiotic stresses, biochemistry and molecular biology of plants. Am Soc Plant Physiol, Rockville MD. 2000:110–158. [Google Scholar]
- 3.Mahajan S, Tuteja N. Cold, salinity and drought stresses: An overview. Arch Biochem Biophy. 2005;444:139–158. doi: 10.1016/j.abb.2005.10.018. [DOI] [PubMed] [Google Scholar]
- 4.Tuteja N. Mechanisms of high salinity tolerance in plants. Methods Enzymol. 2007;428:419–438. doi: 10.1016/S0076-6879(07)28024-3. [DOI] [PubMed] [Google Scholar]
- 5.Kultz D. Evolution of the cellular stress proteome: from monophyletic origin to ubiquitous function. J Exp Biol. 2003;206:3119–3124. doi: 10.1242/jeb.00549. [DOI] [PubMed] [Google Scholar]
- 6.Sung DY, Kaplan F, Lee KJ, Guy CL. Acquired tolerance to temperature extremes. Trends Plant Sci. 2003;4:179–187. doi: 10.1016/S1360-1385(03)00047-5. [DOI] [PubMed] [Google Scholar]
- 7.Kanhonou R, Serrano R, Palau RR. A catalytic subunit of the sugar beet protein kinase CK2 is induced by salt stress and increases NaCl tolerance in Saccharomyces cerevisiae. Plant Mol Biol. 2001;47:571–579. doi: 10.1023/a:1012227913356. [DOI] [PubMed] [Google Scholar]
- 8.Forment J, Naranjo MA, Roldan M, Serrano R, Vicente O. Expression of Arabidopsis SR-like splicing proteins confers salt tolerance to yeast and transgenic plants. Plant J. 2002;30:511–519. doi: 10.1046/j.1365-313x.2002.01311.x. [DOI] [PubMed] [Google Scholar]
- 9.Rausell A, Kanhonou R, Yenush L, Serrano R, Ros R. The translation initiation factor eIF1A is an important determinant in the tolerance to NaCl stress in yeast and plants. Plant J. 2003;34:257–267. doi: 10.1046/j.1365-313x.2003.01719.x. [DOI] [PubMed] [Google Scholar]
- 10.Mundree SG, Whittaker A, Thomson JA, Farrant JM. An aldose reductase homolog from the resurrection plant Xerophyta viscosa. Planta. 2000;211:693–700. doi: 10.1007/s004250000331. [DOI] [PubMed] [Google Scholar]
- 11.Yamada A, Saitoh T, Mimura T, Ozeki Y. Expression of mangrove allene oxide cyclase enhances salt tolerance in Escherichia coli, yeast and tobacco cells. Plant Cell Physiol. 2002;4:903–910. doi: 10.1093/pcp/pcf108. [DOI] [PubMed] [Google Scholar]
- 12.Yamada A, Tsutsumi K, Tanimoto S, Ozeki Y. Plant RelA/SpoT homolog confers salt tolerance in Escherichia coli and Saccharomyces cerevisiae. Plant Cell Physiol. 2003;44:3–9. doi: 10.1093/pcp/pcg001. [DOI] [PubMed] [Google Scholar]
- 13.Leone A, Costa A, Consiglio F, Massarelli I, Dragonetti E, Palma M, De Grillo S. Tolerance to abiotic stresses in potato plants: a molecular approach. Potato Res. 1999;42:333–351. [Google Scholar]
- 14.Kawasaki S, Borchert C, Deyholos M, Wang H, Brazile S, Kawai K, et al. Gene expression profiles during the initial phase of salt stress in rice. Plant Cell. 2001;13:889–905. doi: 10.1105/tpc.13.4.889. [DOI] [PMC free article] [PubMed] [Google Scholar]
- 15.Taji T, Seki M, Satou M, Sakurai T, Kobayashi M, Ishiyama K, et al. Comparative genomics in salt tolerance between Arabidopsis and Arabidopsis-related halophyte salt cress using Arabidopsis microarray. Plant Physiol. 2004;135:1697–1709. doi: 10.1104/pp.104.039909. [DOI] [PMC free article] [PubMed] [Google Scholar]
- 16.Seki M, Narusaka M, Ishida J, Nanjo T, Fujita M, Oono Y, et al. Monitoring the expression profiles of 7,000 Arabidopsis genes under drought, cold and high-salinity stresses using a full-length cDNA microarray. Plant J. 2002;31:279–292. doi: 10.1046/j.1365-313x.2002.01359.x. [DOI] [PubMed] [Google Scholar]
- 17.Sahi C, Agarwal M, Reddy MK, Sopory SK, Grover A. Isolation expression analysis of salt stress associated ESTs from contrasting rice cultivars using a PCR-based subtraction methods. Theor Appl Genet. 2003;106:620–628. doi: 10.1007/s00122-002-1089-8. [DOI] [PubMed] [Google Scholar]
- 18.Shiozaki N, Yamada M, Yoshiba Y. Analysis of salt-stress-inducible ESTs isolated by PCR-subtraction in salt-tolerant rice. Theor Appl Genet. 2005;110:1177–1186. doi: 10.1007/s00122-005-1931-x. [DOI] [PubMed] [Google Scholar]
- 19.Serrano R, Gaxiola R, Rios G, Forment J, Vicente O, Ros R. Salt stress proteins identified by a functional approach in yeast. Monatshefte fur Chemie. 2003;134:1445–1462. [Google Scholar]
- 20.Soto A, Allona I, Collada C, Guevara MA, Casado R, Rodriguez-Cerezo E, et al. Heterologous expression of a plant small heat-shock protein enhances Escherichia coli viability under heat and cold stress. Plant Physiol. 1999;120:521–528. doi: 10.1104/pp.120.2.521. [DOI] [PMC free article] [PubMed] [Google Scholar]
- 21.Kreps JA, Wu Y, Chang HS, Zhu T, Wang X, Harper JF. Transcriptome change for Arabidopsis inresponse to salt, osmotic and cold stress. Plant Physiol. 2002;130:2129–2141. doi: 10.1104/pp.008532. [DOI] [PMC free article] [PubMed] [Google Scholar]
- 22.Xu D, Duan X, Wang B, Hong B, Ho T, Wu R. Expression of a late embryogenesis abundant protein gene, HVA1, from barley confers tolerance to water deficit and salt stress in transgenic rice. Plant Physiol. 1996;110:249–257. doi: 10.1104/pp.110.1.249. [DOI] [PMC free article] [PubMed] [Google Scholar]
- 23.Swire-Clark GA, Marcotte WR., Jr The wheat LEA protein Em functions as an osmoprotective molecule in Saccharomyces cerevisiae. Plant Mol Biol. 1999;39:117–128. doi: 10.1023/a:1006106906345. [DOI] [PubMed] [Google Scholar]
- 24.Yale J, Bohnert HJ. Transcript expression in Saccharomyces cerevisiae at high salinity. J Biol Chem. 2001;276:15996–16007. doi: 10.1074/jbc.M008209200. [DOI] [PubMed] [Google Scholar]
- 25.Kargul J, Barber J. Photosynthetic acclimation: structural reorganization of light harvesting antenna—role of redox-dependent phosphorylation of major and minor chlorophyll a/b binding proteins. FEBS J. 2008;275:1056–1068. doi: 10.1111/j.1742-4658.2008.06262.x. [DOI] [PubMed] [Google Scholar]
- 26.Liu N, Chen AP, Wang F, Zhong NQ, Wang HY, Xia GX. Functional screening of salt stress-related genes from Thellungiella halophila using fission yeast system. Physiologia Plantarum. 2007;129:671–678. [Google Scholar]
- 27.Kim DW, Shibato J, Agrawal GK, Iwahashi H, Kim DH, Shim IS, Rakwal R. Functional categorization of salt stress-responsive genes of rice leaf using DNA microarray. Rice Genet Newsl. 2006;23:67–70. [Google Scholar]
- 28.Nguyen PD, Ho CL, Harikrishna JA, Wong MCVL, Abdul Rahim R. Functional screening for salinity tolerant genes from Acanthus ebracteatus Vahl using Escherichia coli as a host. Trees-Structure Function. 2007;21:515–520. [Google Scholar]
- 29.Pruitt RE, Vielle-Calzada JP, Ploense SE, Grossniklaus U, Lolle SJ. FIDDLEHEAD, a gene required to suppress epidermal cell interactions in Arabidopsis, encodes a putative lipid biosynthetic enzyme. Proc Natl Acad Sci USA. 2000;97:1311–1316. doi: 10.1073/pnas.97.3.1311. [DOI] [PMC free article] [PubMed] [Google Scholar]
- 30.Efremova N, Schreiber L, Bär S, Heidmann I, Huijser P, Wellesen K, et al. Functional conservation and maintenance of expression pattern of FIDDLEHEAD-like genes in Arabidopsis and Antirrhinum. Plant Mol Biol. 2004;56:821–837. doi: 10.1007/s11103-004-5576-y. [DOI] [PubMed] [Google Scholar]
- 31.Gong Q, Li P, Ma S, Indu Rupassara S, Bohnert HJ. Salinity stress adaptation competence in the extremophile Thellungiella halophila in comparison with its relative Arabidopsis thaliana. Plant J. 2005;44:826–839. doi: 10.1111/j.1365-313X.2005.02587.x. [DOI] [PubMed] [Google Scholar]
- 32.Du J, Huang YP, Xi J, Cao MJ, Ni WS, Chen X, et al. Functional gene-mining for salt-tolerance genes with the power of Arabidopsis. Plant J. 2008;56:653–664. doi: 10.1111/j.1365-313X.2008.03602.x. [DOI] [PMC free article] [PubMed] [Google Scholar]
- 33.Holton' TA, Cornish EC. Genetics and biochemistry of anthocyanin biosynthesis. Plant Cell. 1995;7:1071–1083. doi: 10.1105/tpc.7.7.1071. [DOI] [PMC free article] [PubMed] [Google Scholar]
- 34.Vanderauwera S, Zimmermann P, Rombauts S, Vandenabeele S, Langebartels C, Gruissem W, et al. Genome-wide analysis of hydrogen peroxide-regulated gene expression in Arabidopsis reveals a high light-induced transcriptional cluster involved in anthocyanin biosynthesis. Plant Physiol. 2005;139:806–821. doi: 10.1104/pp.105.065896. [DOI] [PMC free article] [PubMed] [Google Scholar]
- 35.Piao HL, Lim JH, Kim SJ, Cheong GW, Hwang I. Constitutive overexpression of AtGSK1 induces NaCl stress responses in the absence of NaCl stress and results in enhanced NaCl tolerance in Arabidopsis. Plant J. 2001;27:305–314. doi: 10.1046/j.1365-313x.2001.01099.x. [DOI] [PubMed] [Google Scholar]
- 36.Yamaguchi-Shinozaki K, Shinozaki K. A novel cis-acting element in an Arabidopsis gene is involved in responsiveness to drought, low-temperature or high-salt stress. Plant Cell. 1994;6:251–264. doi: 10.1105/tpc.6.2.251. [DOI] [PMC free article] [PubMed] [Google Scholar]
- 37.Thomson JD, Higgings DG, Gibson TJ. CLUSTALW: improving the sensitivity of progressive multiple sequence alignment through sequence weighting, position-specific gap penalties and weight matrix chose. Nucl Acids Res. 1994;22:4673–4680. doi: 10.1093/nar/22.22.4673. [DOI] [PMC free article] [PubMed] [Google Scholar]
- 38.Desper R, Gascuel O. Fast and accurate phylogeny reconstruction algorithms based on the minimum-evolution. Principle J Comput Biol. 2002;9:687–706. doi: 10.1089/106652702761034136. [DOI] [PubMed] [Google Scholar]


