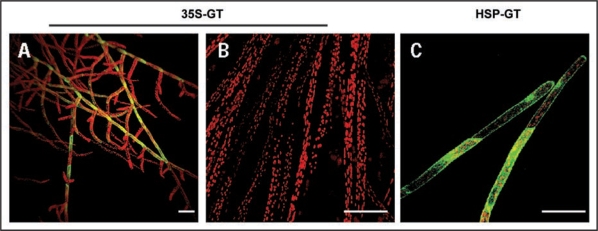
Figure 1.
Confocal images showing GFP-talin expression in 35S-GT and HGT lines. (A–C) Merged confocal images displaying auto fluorescence of chloroplasts (in red) and fluorescence signal of GFP (in green). (A) 35S-GT grown under standard conditions. Ten days old, dark grown caulonemal cells of (B) 35S-GT and (C) HGT lines. The 35S-GT cells were imaged immediately after light exposure, whereas HGT cells were heat treated in darkness for 1 h at 36°C and imaged 16 hours after treatment. Bars: 100 µm.

