
Figure 3. Sensory-mnemonic correlations.
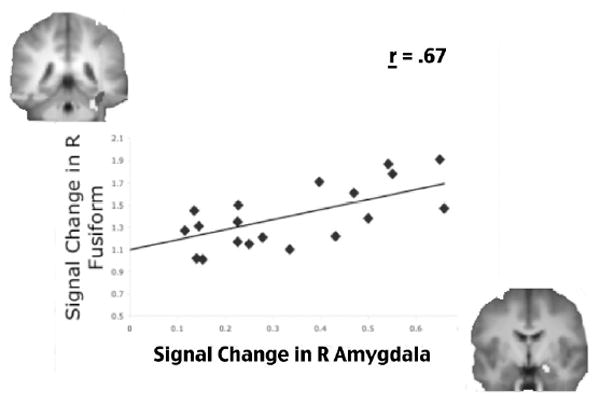
During the encoding of negative items that would later be remembered with specific visual detail, participants showed a robust correlation between the amount of activity in the right amygdala (x-axis) and the amount of activity in the right fusiform gyrus (y-axis). Each diamond represents one participant. Data from those published in Kensinger, Garoff-Eaton, & Schacter, 2007.