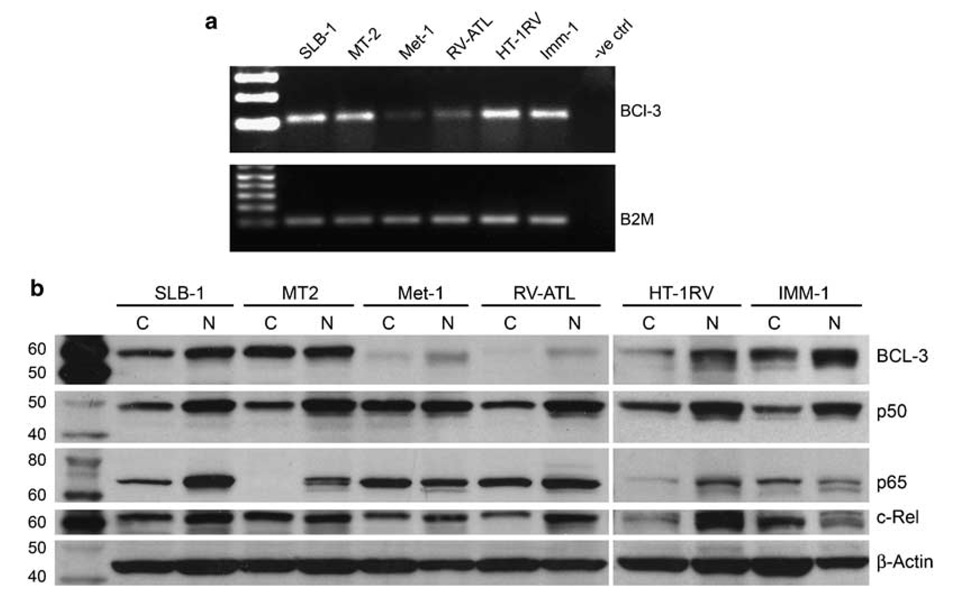
Figure 7.
Bcl-3 expression was high in HTLV-1-infected T cells compared to ATLL cells: (a) RT–PCR was performed on total RNA isolated from various cells as indicated on the top row using primers specific for Bcl-3. β2-Microglobulin was used as a loading control. (b) Western blot analysis was performed on the cytoplasmic and nuclear lysates of various cells and probed with antibodies specific for Bcl-3, p50, p65 and c-Rel. β-Actin was used as protein loading control.

