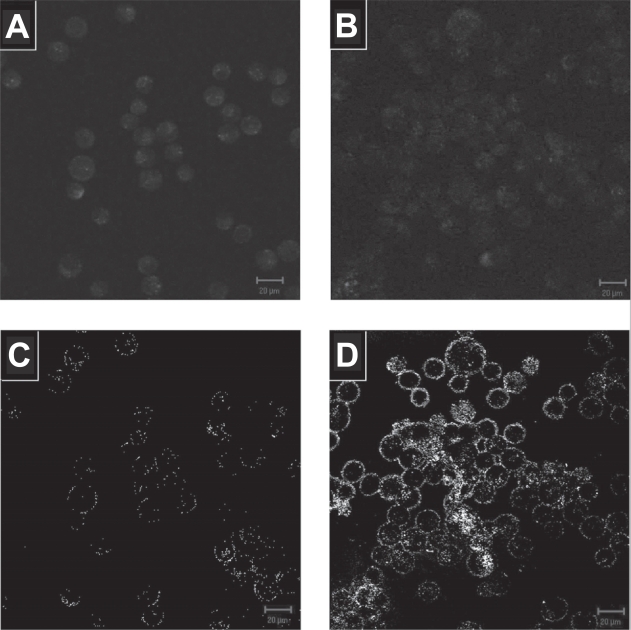
Figure 4.
Autofluorescence image of (a) NHLF and (b) CNE2 cells. Their corresponding confocal reflectance images after labeling the (c) NHLF and (d) CNE2 cells with anti-EGFR gold nanoparticles is shown below the autofluorescence image. Images are cross-sectional slices of cells taken at the mid-focal plane at 20X magnification. Falsecolor fluorescence images obtained at excitation 488 nm and reflectance images obtained at excitation 633 nm. Scale bar in all images is 20 μm.

