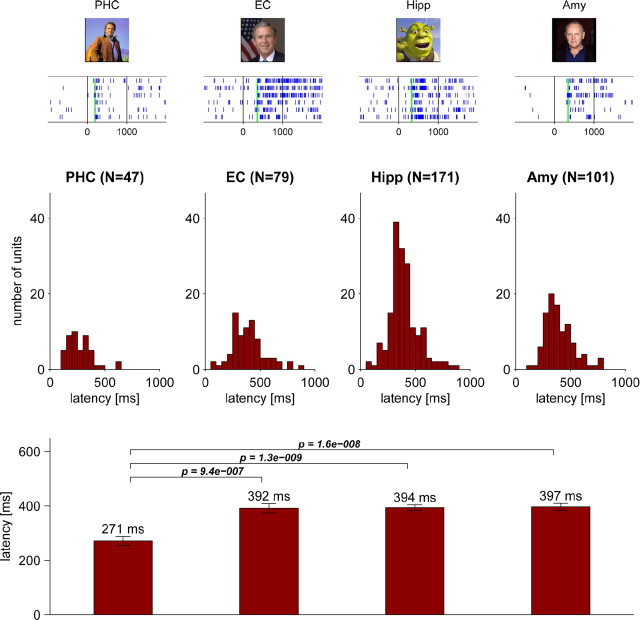
Figure 2.
Response latency of neurons in the human MTL. A total of 398 neurons responded to one or more visual stimuli with a significant (p < 0.001) increase in firing rate relative to baseline. Top, Exemplary raster plots of visual responses in the parahippocampal cortex (PHC), entorhinal cortex (EC), hippocampus (Hipp), and amygdala (Amy), with typical latencies calculated using Poisson spike train analysis and denoted by green vertical lines. Middle, Latency histograms of responsive neurons in each region (in 50 ms bins, absolute cell numbers). Bottom, Mean latencies ± SEM and pairwise statistical comparison of latencies across regions (two-sided Mann–Whitney U test; only p values <0.05 are shown).

